Bank – ESN Data (Openclassroom)
Analyze Customer Churn
Fictional
|
27/11/2024 > 13/12/2024
Context
In this project, I joined ESN Data (fictitious), an IT consulting firm, as a junior Business Intelligence consultant. My mission was to collaborate with Mehdi, a senior consultant, on a project for the client Primero Bank (fictitious).
The bank was facing a concerning increase in its customer churn rate. The goal of the project was to analyze customer data to identify the reasons behind departures and anticipate future churn, in order to help the sales management make informed decisions.
Datasets
Source: Data extracted from Primero Bank’s CRM system.
Nature: Customer information (profiles, history, usage behavior, churn or loyal status).
Volume: Dataset covering all customers (10,127 records, 15 key attributes), large enough to require filters, pivot tables, and descriptive statistics
Workflow
- Data exploration and preparation in Excel: sorting, filtering, creating calculated columns, and checking data integrity
- Descriptive analysis with pivot tables to compare churned vs retained customer profiles
- Visualizations tailored to the context (bar charts, pie charts, combo charts, donut charts) following accessibility best practices (WebAIM Contrast Checker, Microsoft Accessibility)
Insights
- Overall churn rate: 16% of customers left the bank recently.
- Churners vs retained profiles:
- Marital status: 57% of churners were married vs 43% of retained customers (+14%)
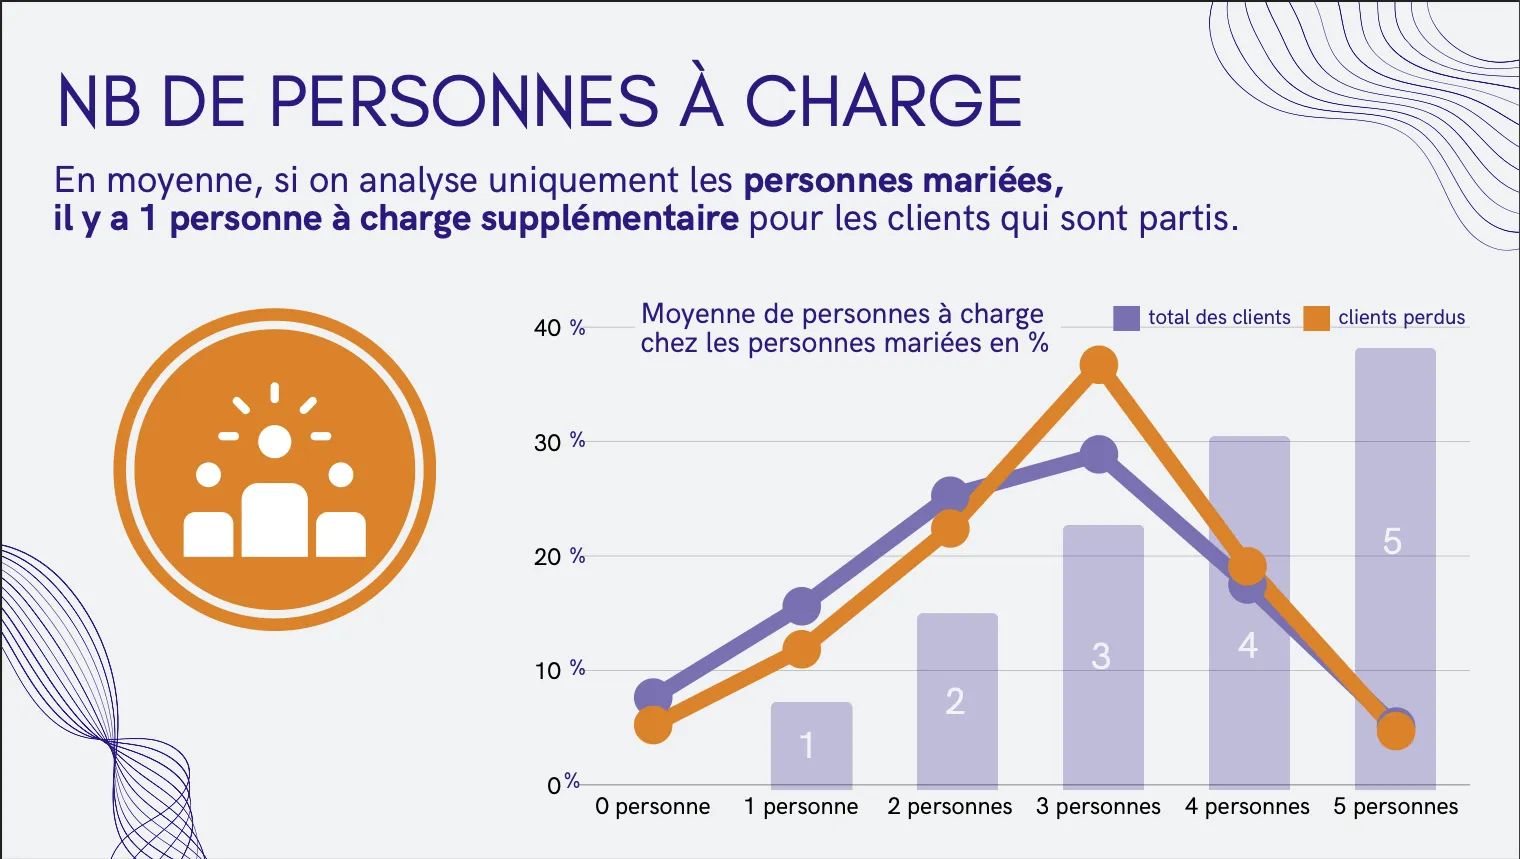
- Dependents: married churners had on average one more dependent than others
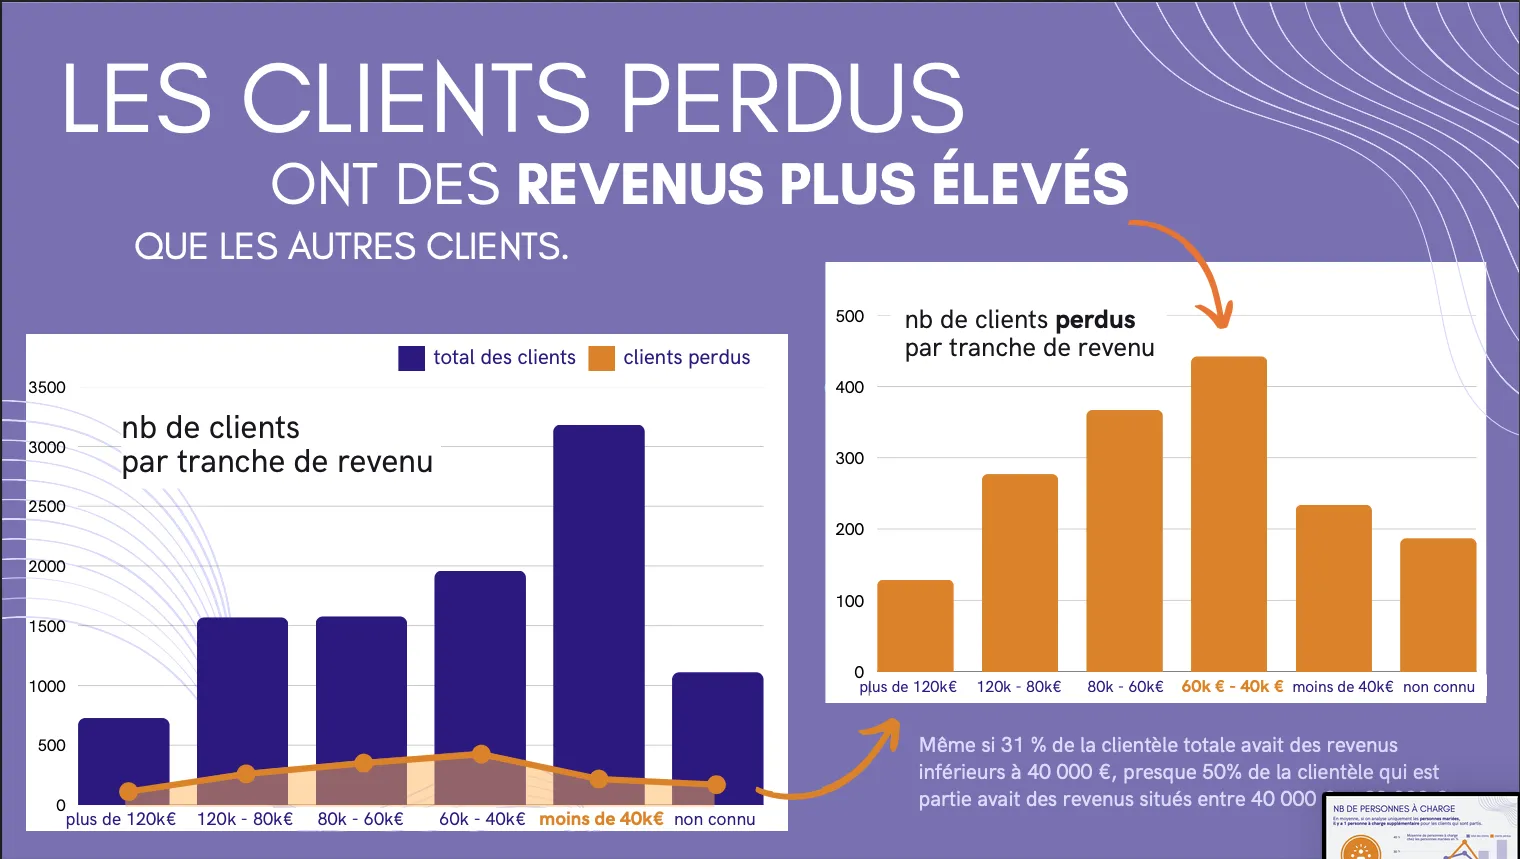
- Income: nearly 50% of churners had an annual income between €40,000 and €80,000 (vs 31% overall)
- Credit renewal: churners renewed less credit on average than retained clients
- Inactivity: churners remained inactive one month longer on average than other clients
- Customer service: 60% of churners contacted customer service more often, possibly indicating dissatisfaction
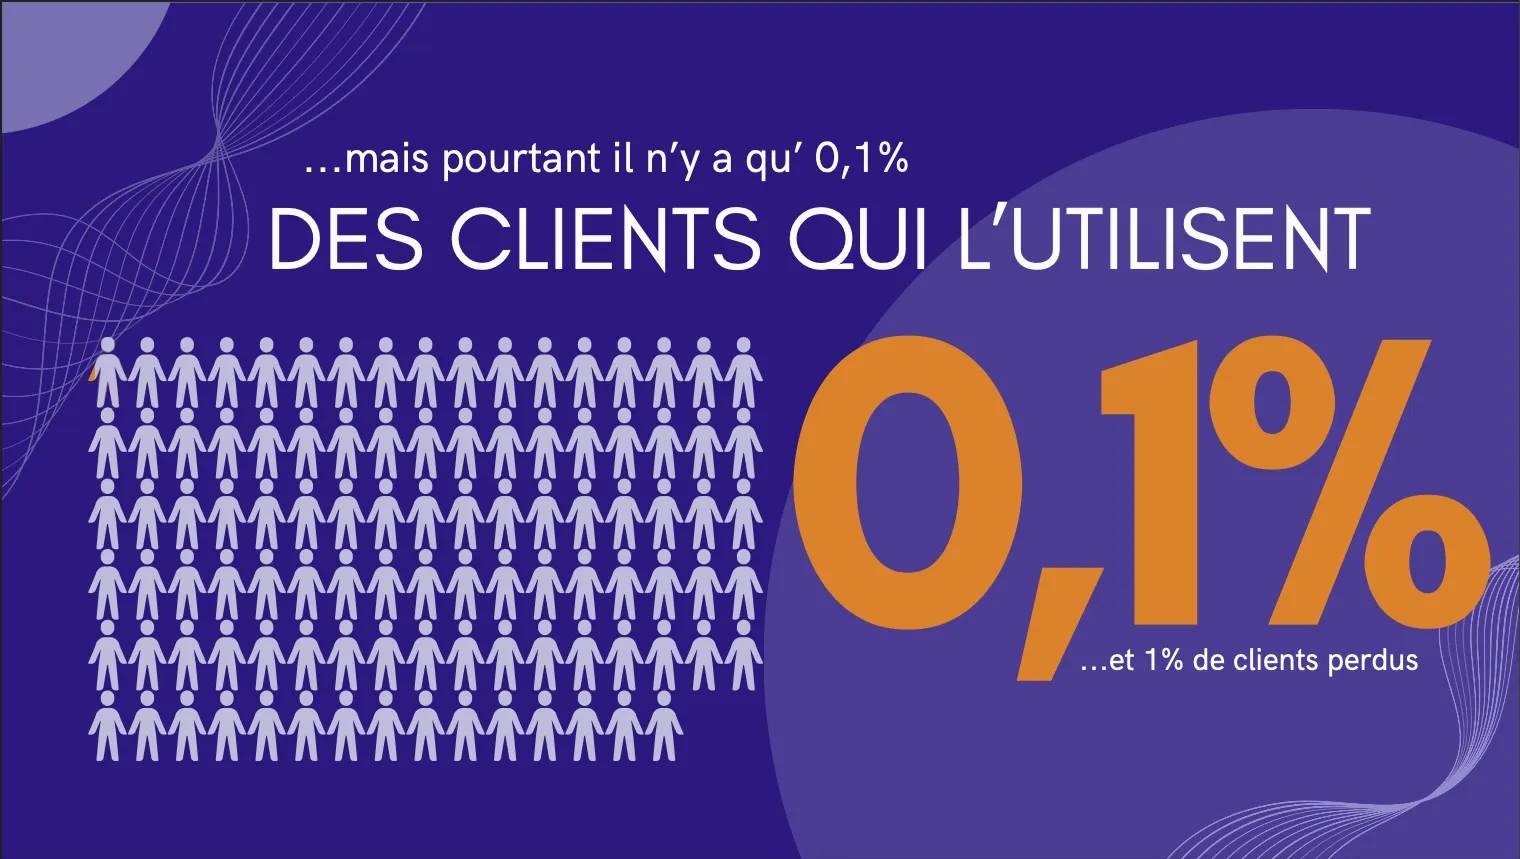
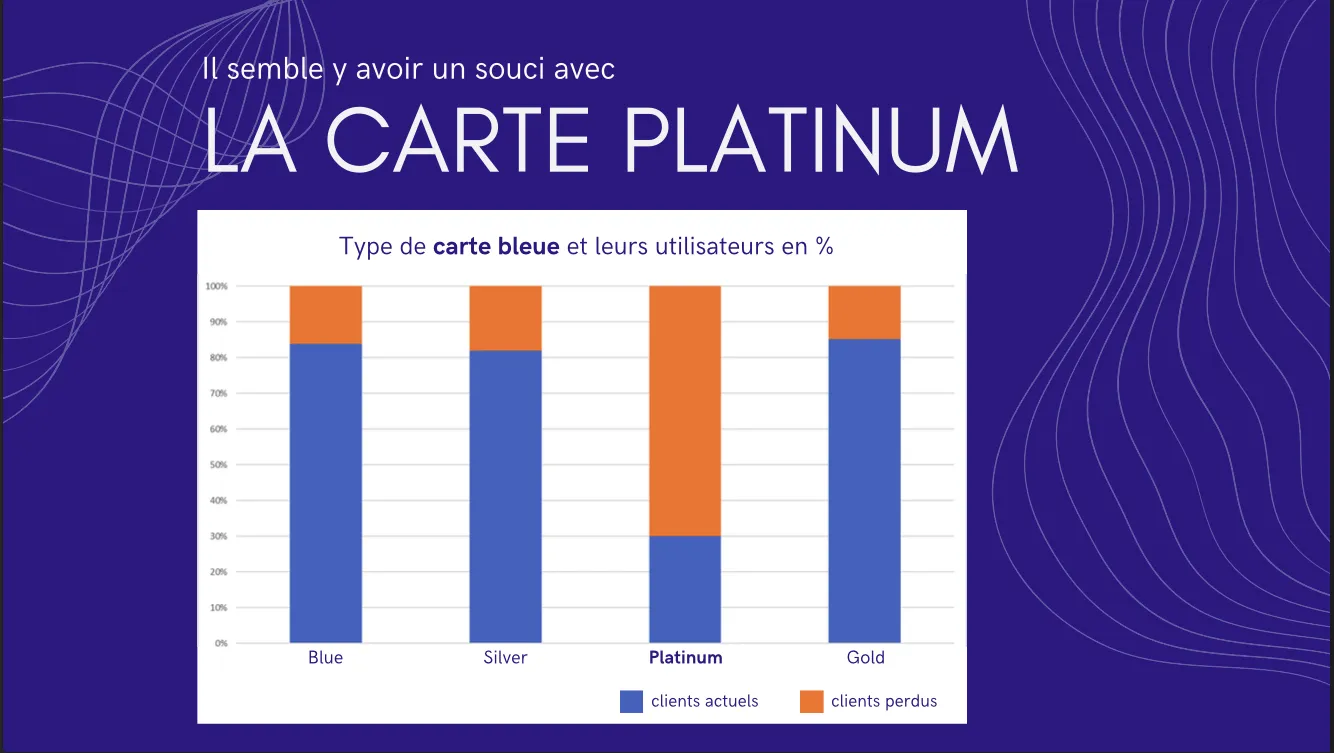
- Platinum card: despite its issues, only 0.1% of churned customers held the Platinum card
- At-risk segments: I identified inactive customers (1,803) and couples with children (1,552) as top priorities for retention efforts
Business Impact
I produced a structured analysis report, validated by Mehdi, and a 15-slide presentation designed for Paola, the bank’s marketing director.
My work made it possible to:
- Identify high-risk profiles, enabling the team to launch targeted retention actions
- Deliver accessible visualizations that made the data clear for non-experts
- Raise awareness about the importance of data visualization in business communication
Based on these insights, I presented the following operational recommendations to Paola:
- Rework the benefits and services of the Platinum card to boost its appeal
- Develop tailored offers for families (couples with children)
- Implement automated follow-ups and reactivation for inactive clients
- Create a program for high-investment-potential clients to strengthen their loyalty