Real estate – Les Plus Beaux Logis de Paris (Openclassroom)
Real‑Estate Price Prediction
Fictional
|
11/04/2025 > 07/05/2025

Context
As a Business Intelligence Analyst at ESN Data (fictional), I was asked by Jade (the director) to support “Les Plus Beaux Logis de Paris” on two consecutive missions:
- Historical analysis: study the evolution of real estate prices in Paris (2017–2021) to identify market dynamics and key correlations.
- Predictive modeling and clustering:
- Build a linear regression model to predict the future valuation of the company’s asset portfolio.
- Implement a K-Means clustering algorithm to automatically classify properties (apartments vs commercial spaces), addressing a request from Louise (director at “Les Plus Beaux Logis de Paris”).
Datasets
- df_histo_immo: historical property sales in Paris from 2017 to 2021 (transactions = 26,196, fields: transaction date, sale price, street number, street name, postal code, city, property type code, property type, surface)
- df_actifs: company asset portfolio for 2022, in two versions:
- Portfolio 1: 275 properties (154 individuals, 121 corporate)
- Portfolio 2: 469 properties (310 individuals, 159 corporate)
- Clustering sample: property data provided by Louise’s team to validate the K-Means model
Workflow
- Environment: Jupyter Notebook (Python 3) using pandas, numpy, matplotlib, seaborn, plotly, statsmodels, scikit-learn
- EDA:
- Type checking, counting by property type
- Time span calculation
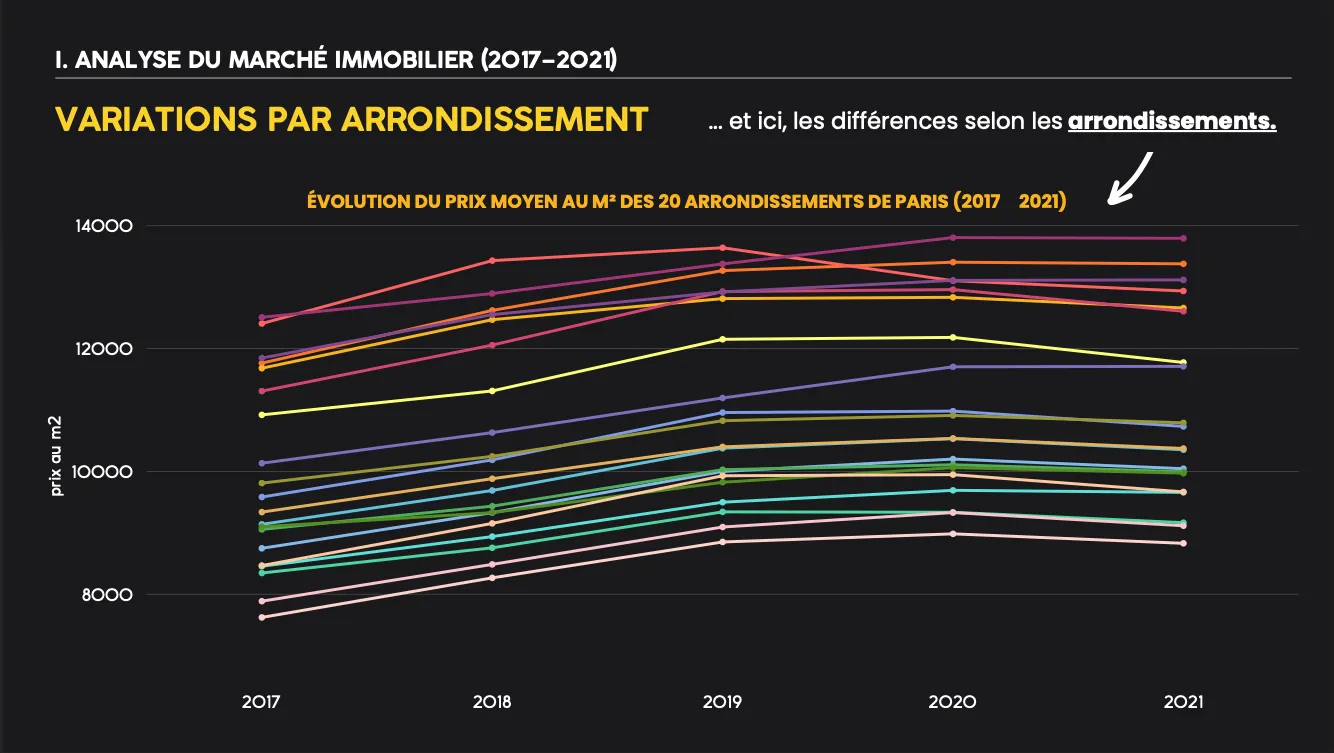
- Evolution of average price per m² overall and by district (2017→2021)
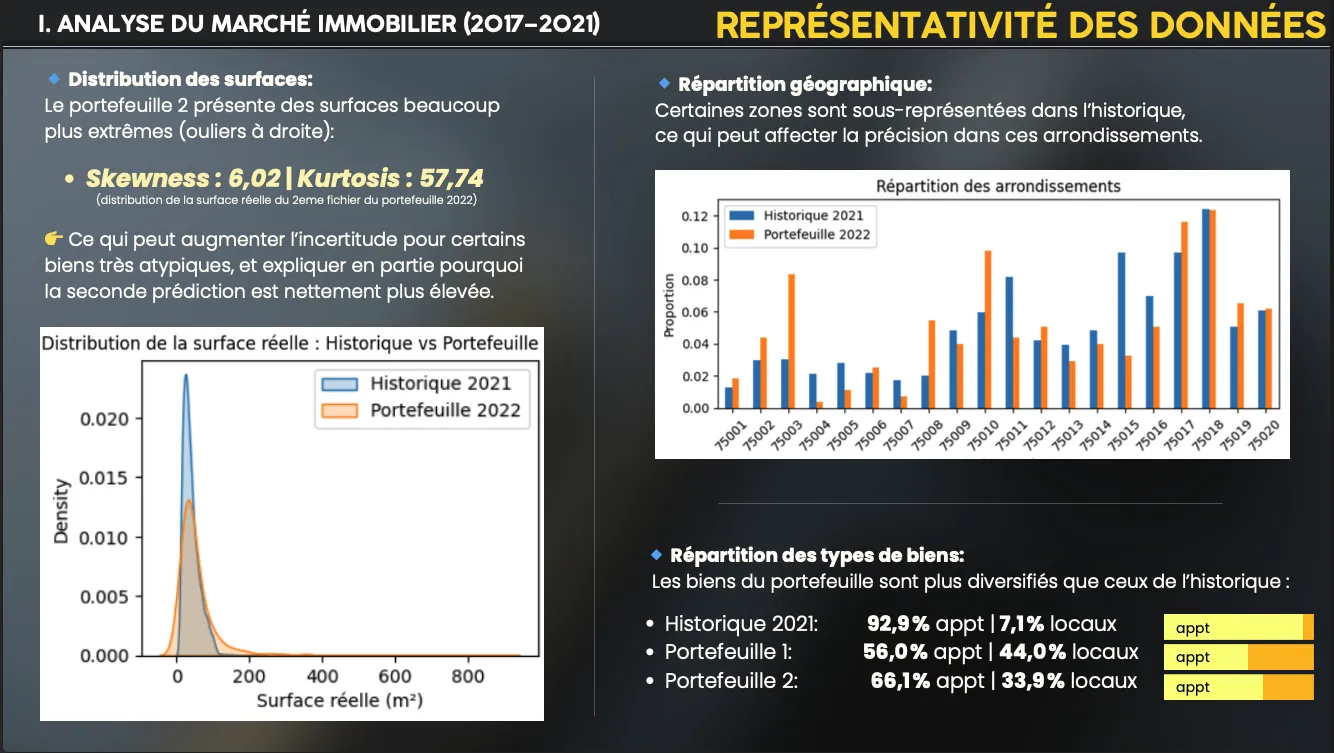
- Representativeness analysis (apartments vs commercial)
- Pearson correlation tests: price/m² vs date, price/m² vs surface
- Price/m² comparison between apartments and commercial units
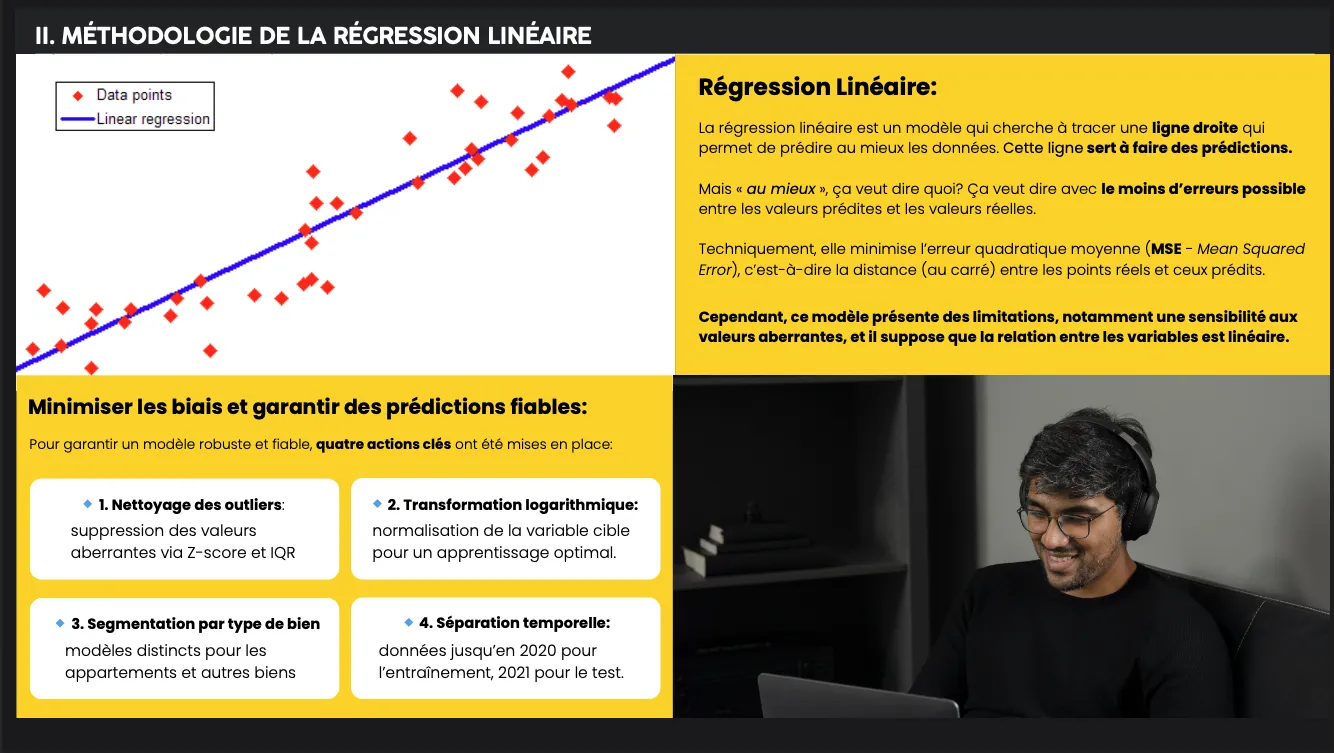
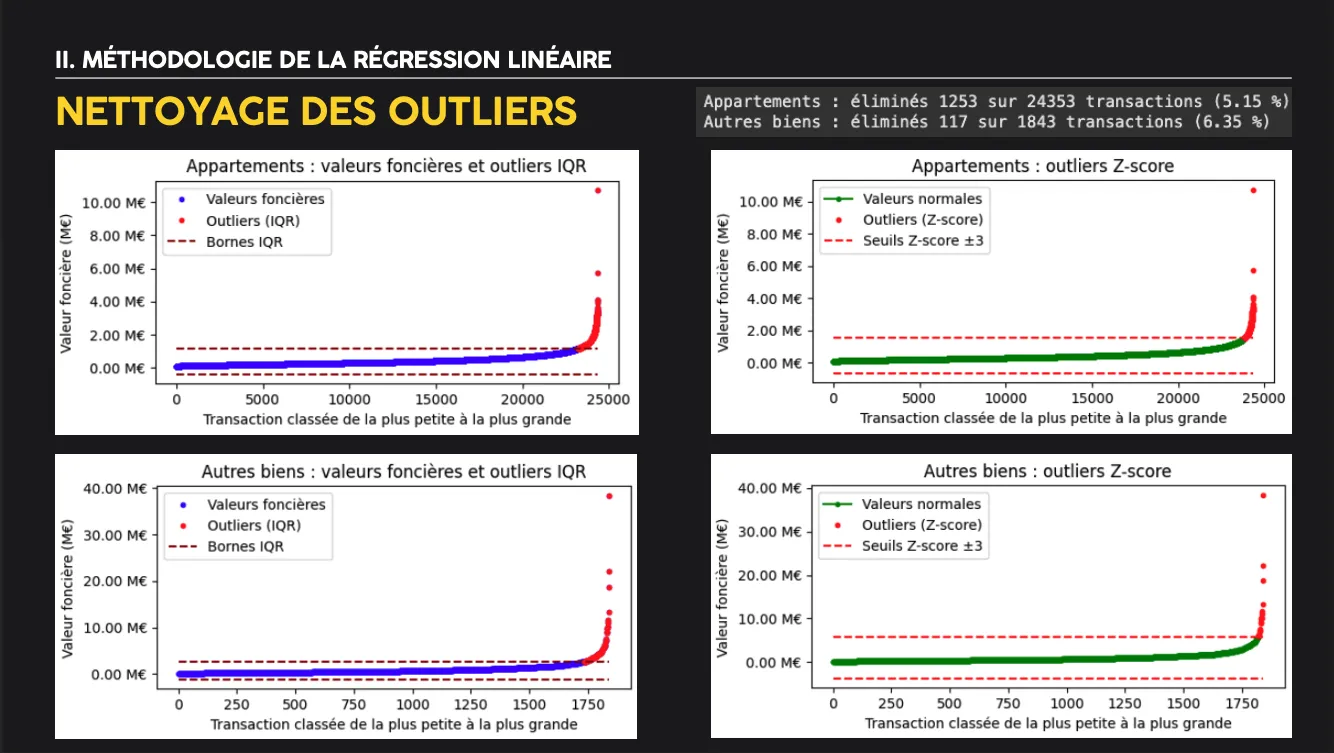
- Linear regression:
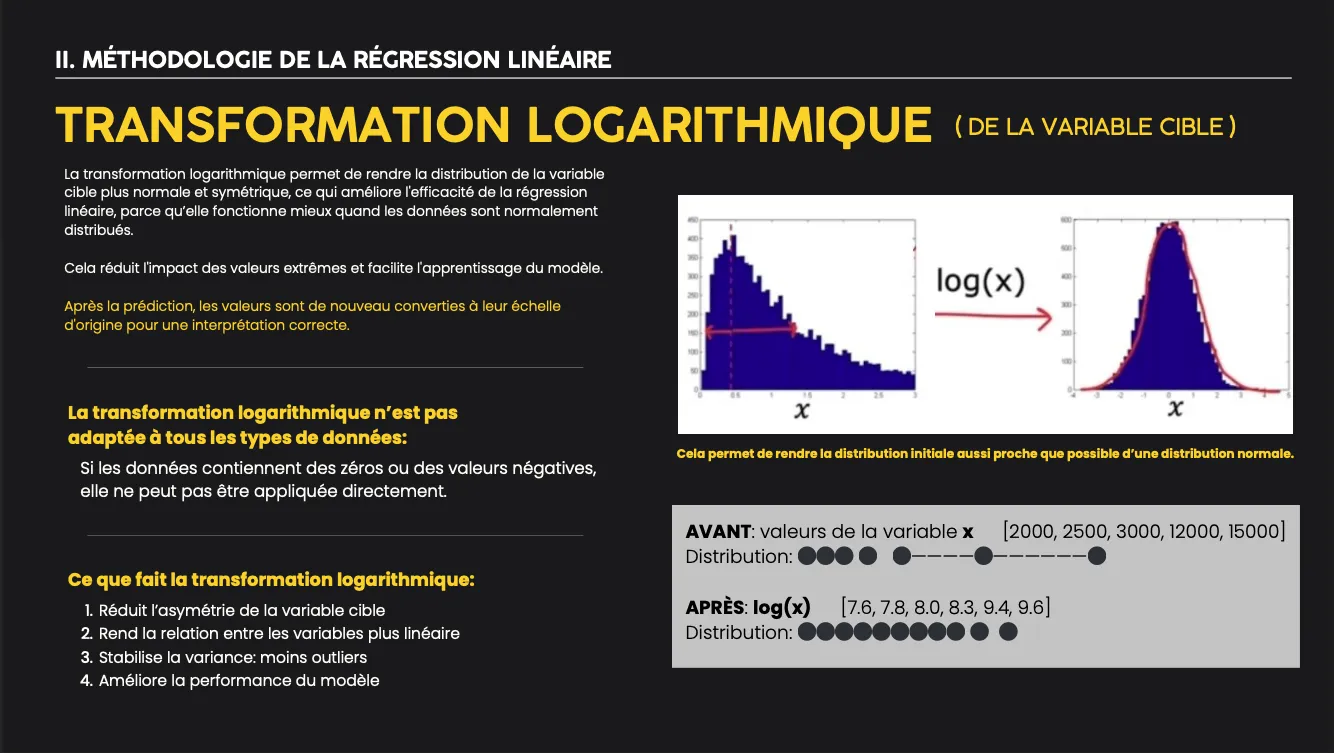
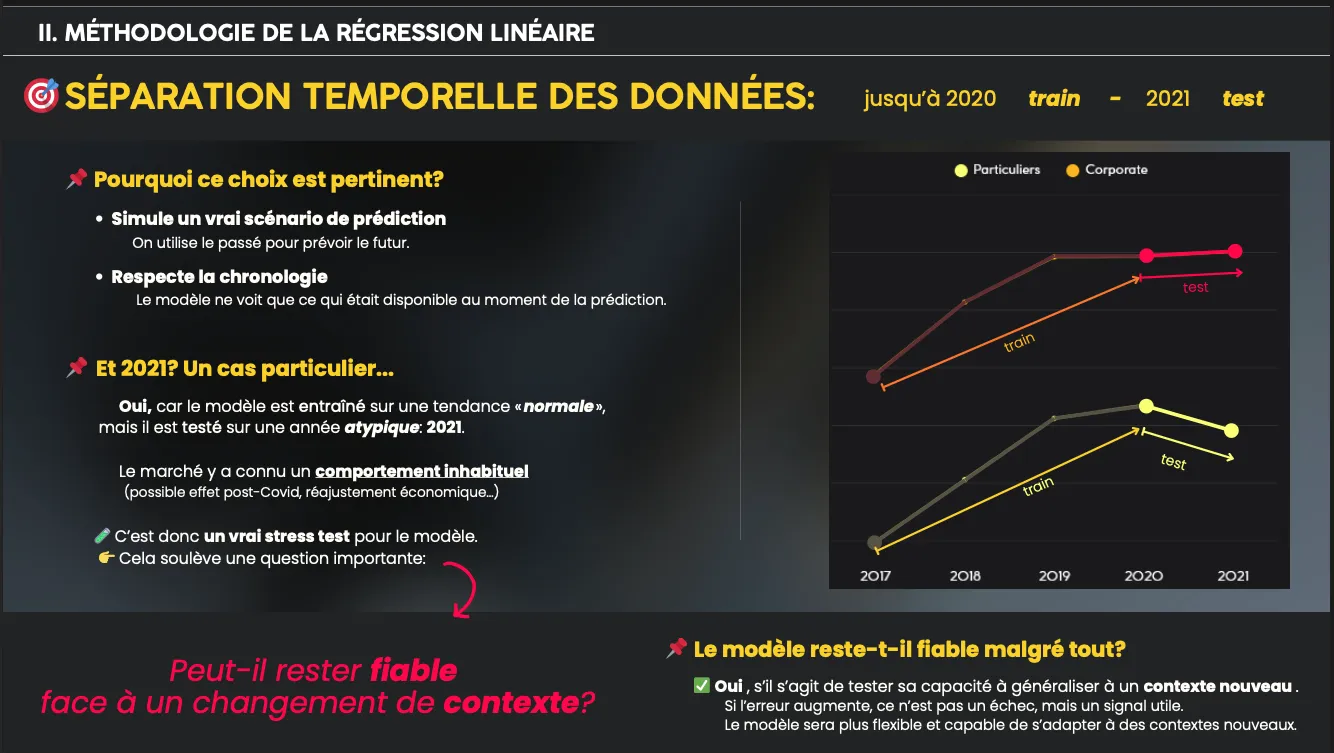
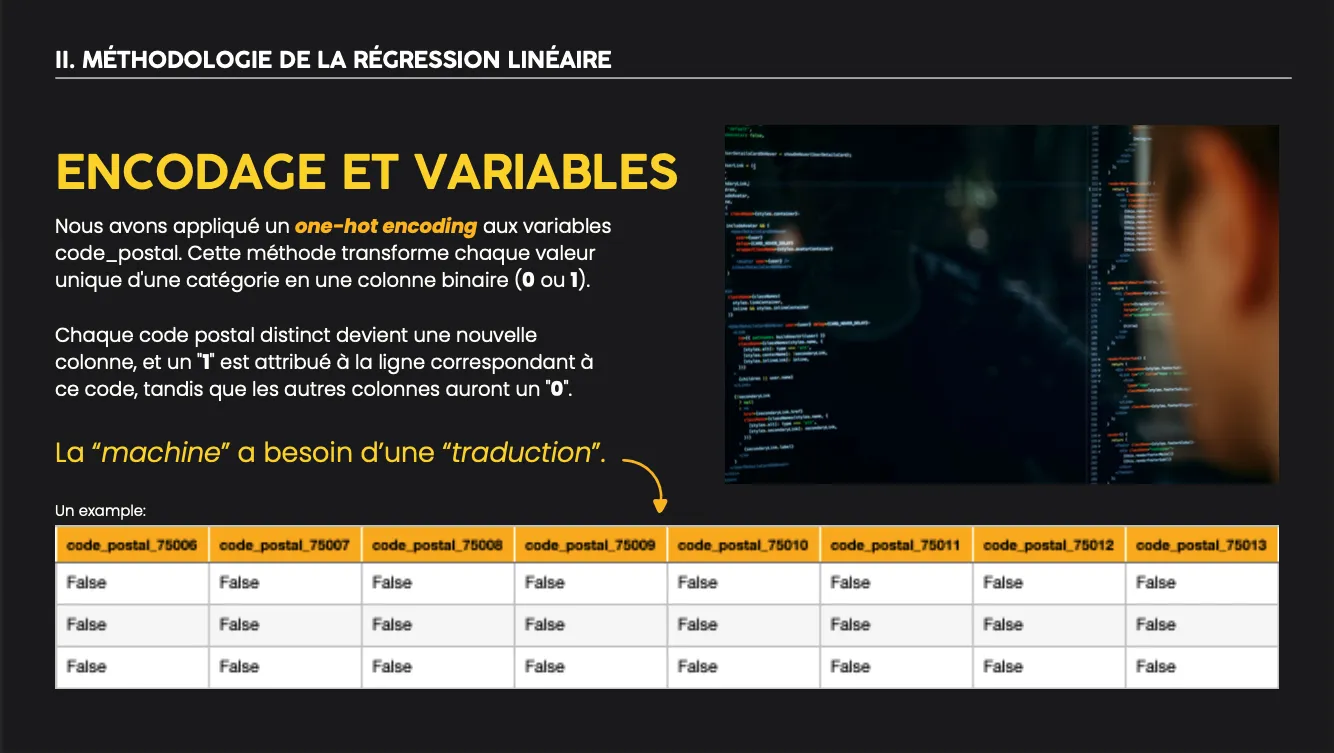
- Preprocessing: log transformation of target variable, one-hot encoding of postal codes, time-based train/test split (train ≤ 2020, test = 2021)
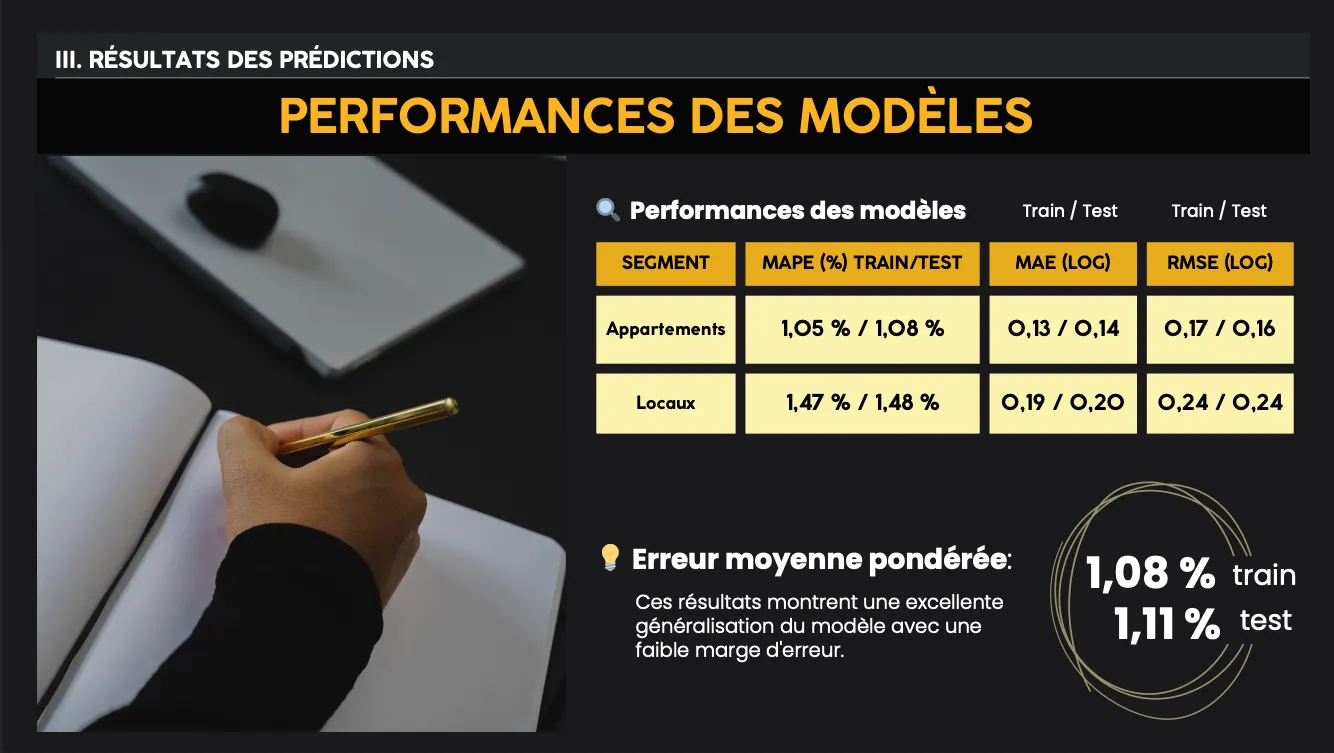
- Model training with LinearRegression, evaluation using MAE as percentage
- Validation goal: <10% mean error
- K-Means clustering:
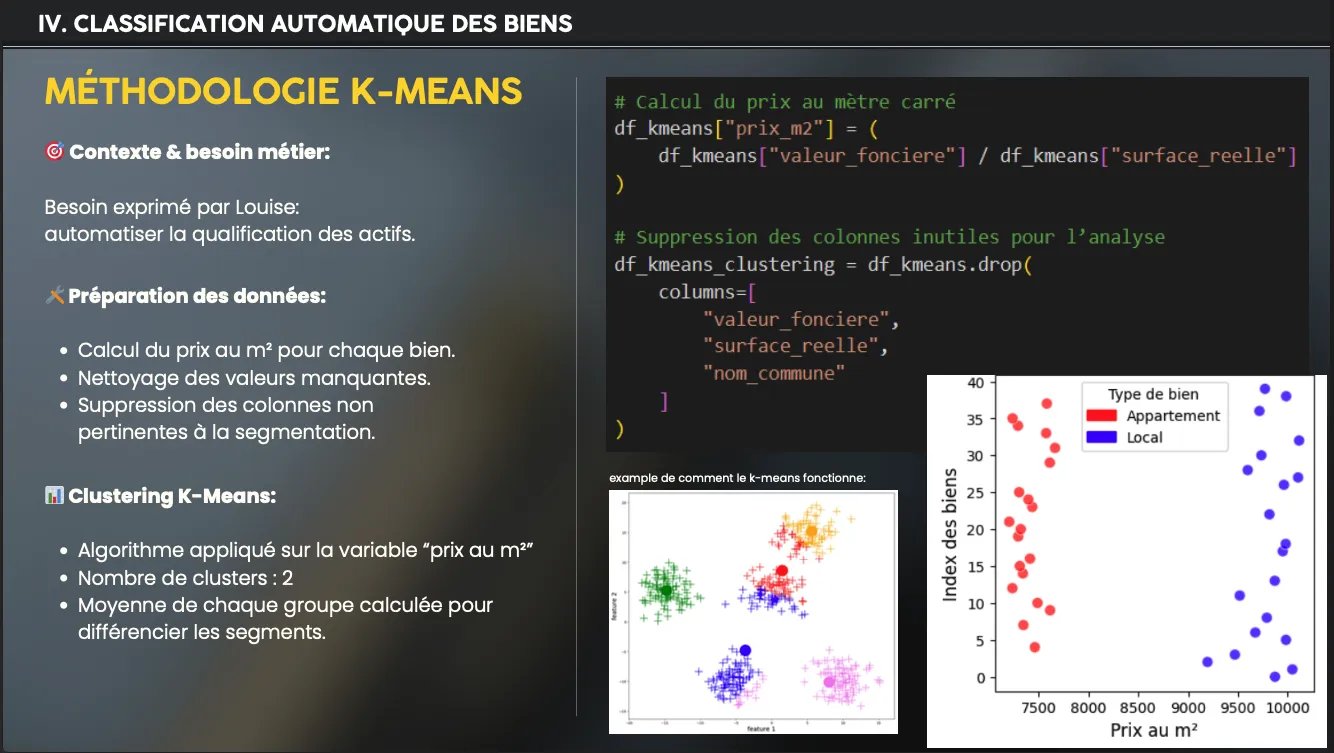
- Preparation: compute price per m², handle missing values, variable selection
- K-Means application (k=2), cluster interpretation, mapping to categories (apartment vs commercial)
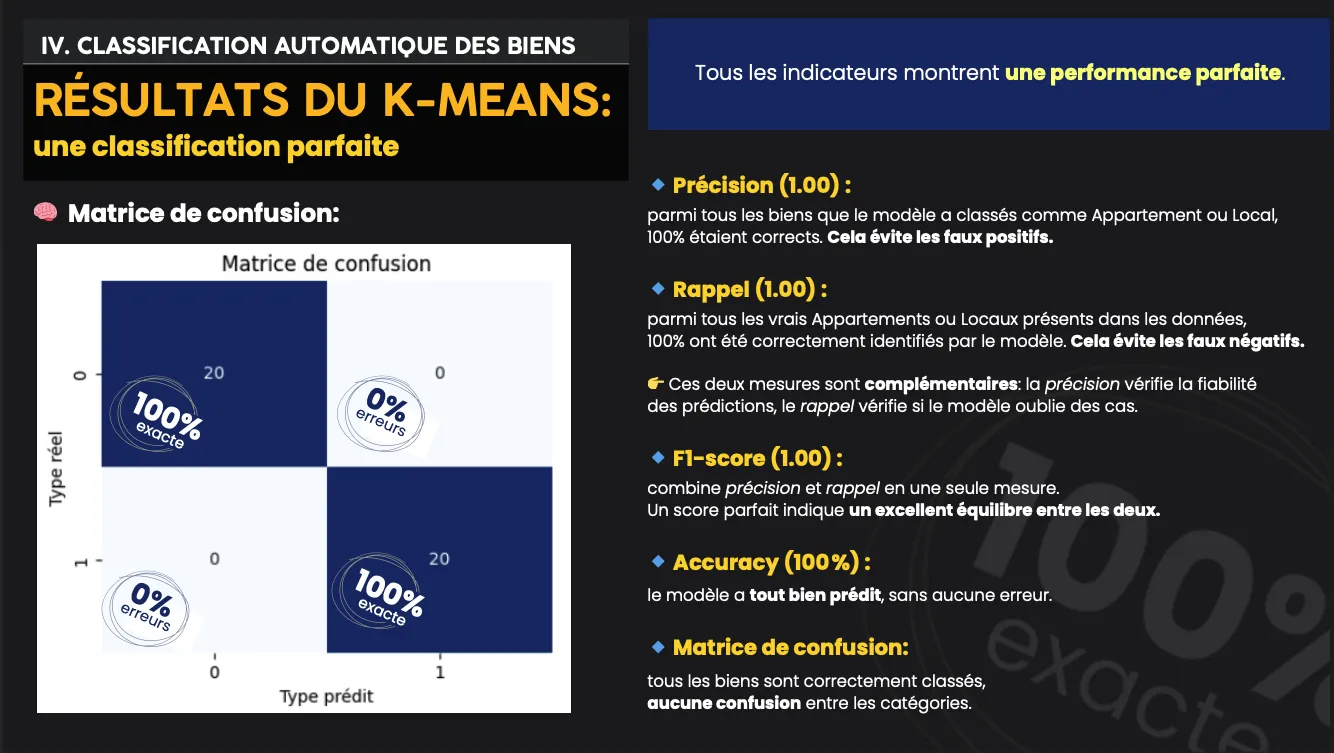
- Evaluation: f1-score, accuracy, confusion matrix
Insights
- Market trends: Prices rose steadily before COVID, then slowed down. Each district has its own price level but follows a similar trend.
- Representativeness:
- 2021 historical data: 92.9% apartments vs 7.1% commercial
- Portfolio 1: 56.0% apartments vs 44.0% commercial
- Portfolio 2: 66.1% apartments vs 33.9% commercial
- Predictions:
- Portfolio 1 valuation: €67.5M (individual) | €111.9M (corporate)
- Portfolio 2 valuation: €788.5M (individual) | €52,454.8M (corporate)
- Weighted mean error: 1.08% (train), 1.11% (test)
- Clustering:
- f1-score = 1.00; accuracy = 100%
- Perfect classification (confusion matrix with no errors)
Business Impact
- Executives now have a solid historical analysis to understand price dynamics by district
- The regression model anticipates portfolio valuation with controlled error (<1.5%), supporting investment decisions
- Automated clustering replaces manual categorization, saving time and ensuring reliable property classification