E-commerce – Bottleneck (Openclassroom)
Dashboard & Business Recommandations
Fictional
|
08/05/2025 > 11/06/2025

Context
Back at BottleNeck (fictional) after my stock optimization project, I was assigned a new mission by Nicolas (Head of Sales):
- Step 1: analyze three data access solutions (direct SQLite connection, CSV export, ETL) and recommend the best approach through a documented report.
- Step 2: import the cleaned and consolidated data into an interactive Tableau dashboard, including at least 3 business recommendations for Florian (CEO) and the product managers.
Datasets
- Source: SQLite export covering the period from October 1, 2022 to September 30, 2023 (tables: Web, Finance, Sales, Promo, ca_par_segment).
- Nature:
- Web: product references, ratings, comments, segments (761 rows × 17 columns)
- Finance: purchase prices, sale prices, status (11,322 rows × 6 columns)
- Sales: volumes (excluding and including promos), orders, end-of-month stock (9,564 rows × 12 columns)
- Promo: offer details, promo sales (698 rows × 9 columns)
- ca_par_segment: revenue aggregated by segment (5 rows × 2 columns)
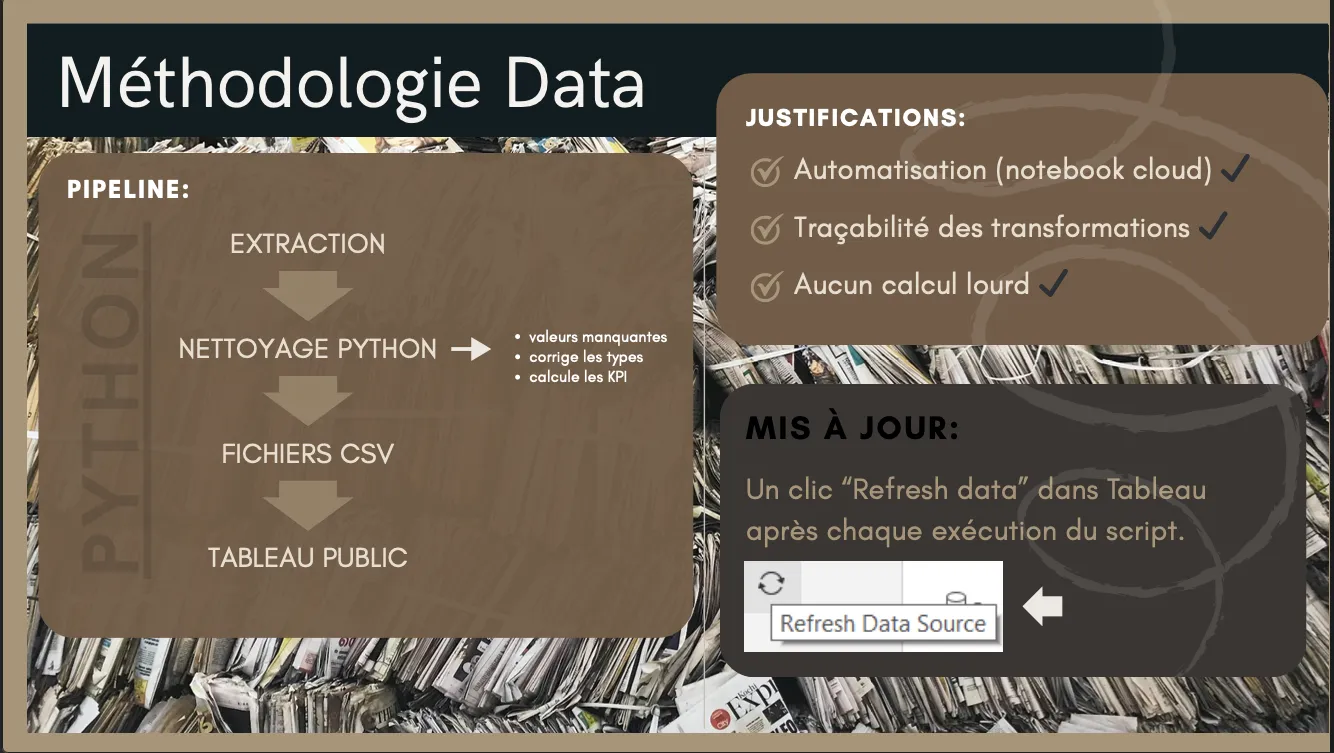
Workflow
- Analysis of solutions: comparison (pros/cons) of SQL direct connection, CSV extraction, visual ETL (KNIME/Power Query).
- Technology choice:
- Extraction & cleaning: Python pipeline (SQLite3→pandas) executed in Google Colab to normalize types, fix duplicates, impute missing values, calculate KPIs, and generate CSV.
- Visualization: Tableau Public (connected to CSVs), no DAX, drag-and-drop interface accessible on macOS/Windows/web.
- Data cleaning: format conversion (float, datetime, bool), NaN handling, creation of new columns (gross margin, stock turnover, conversion rate, ROI), reproducibility ensured via versioned scripts.
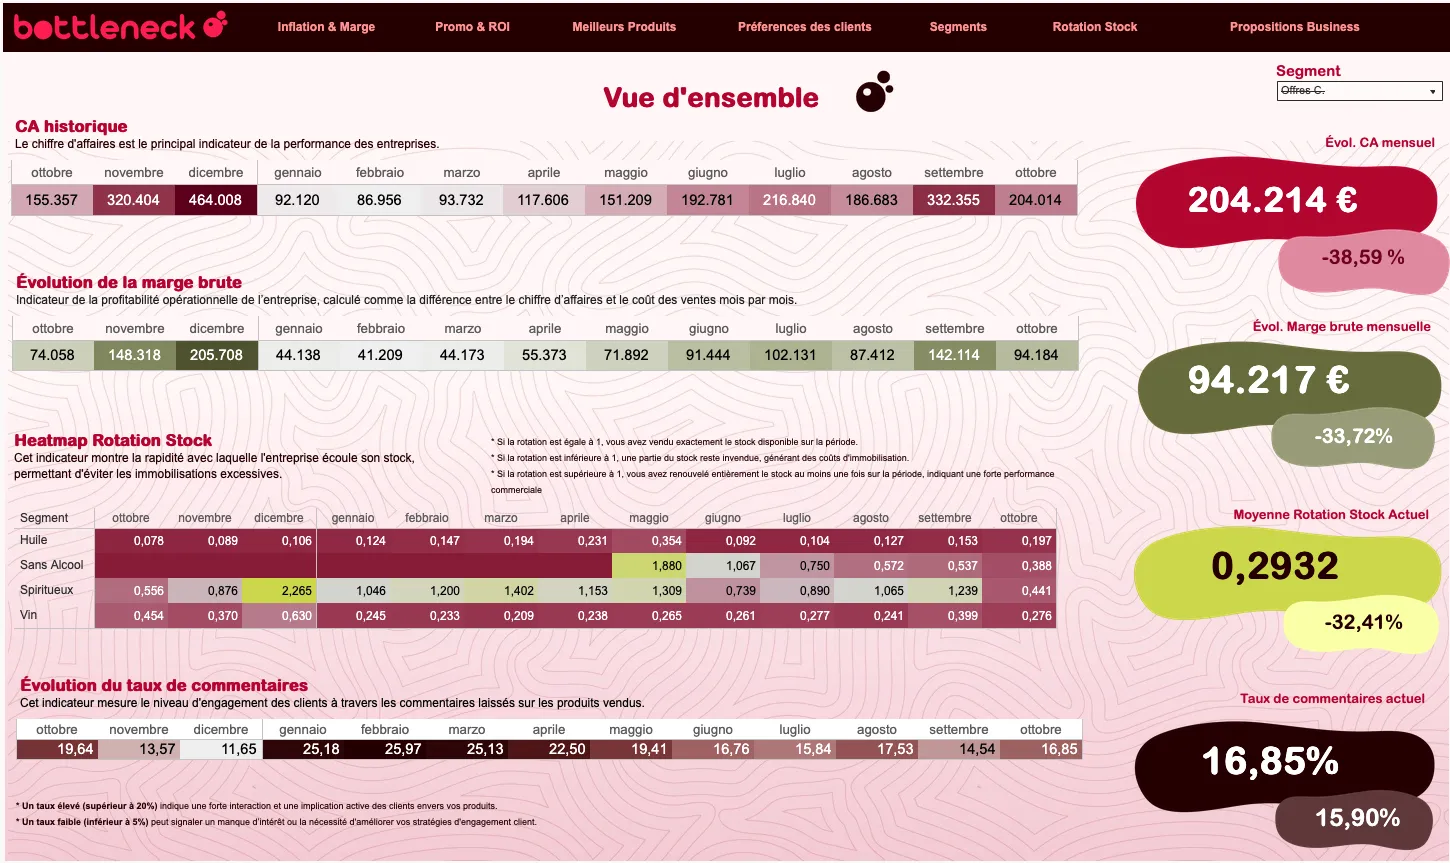
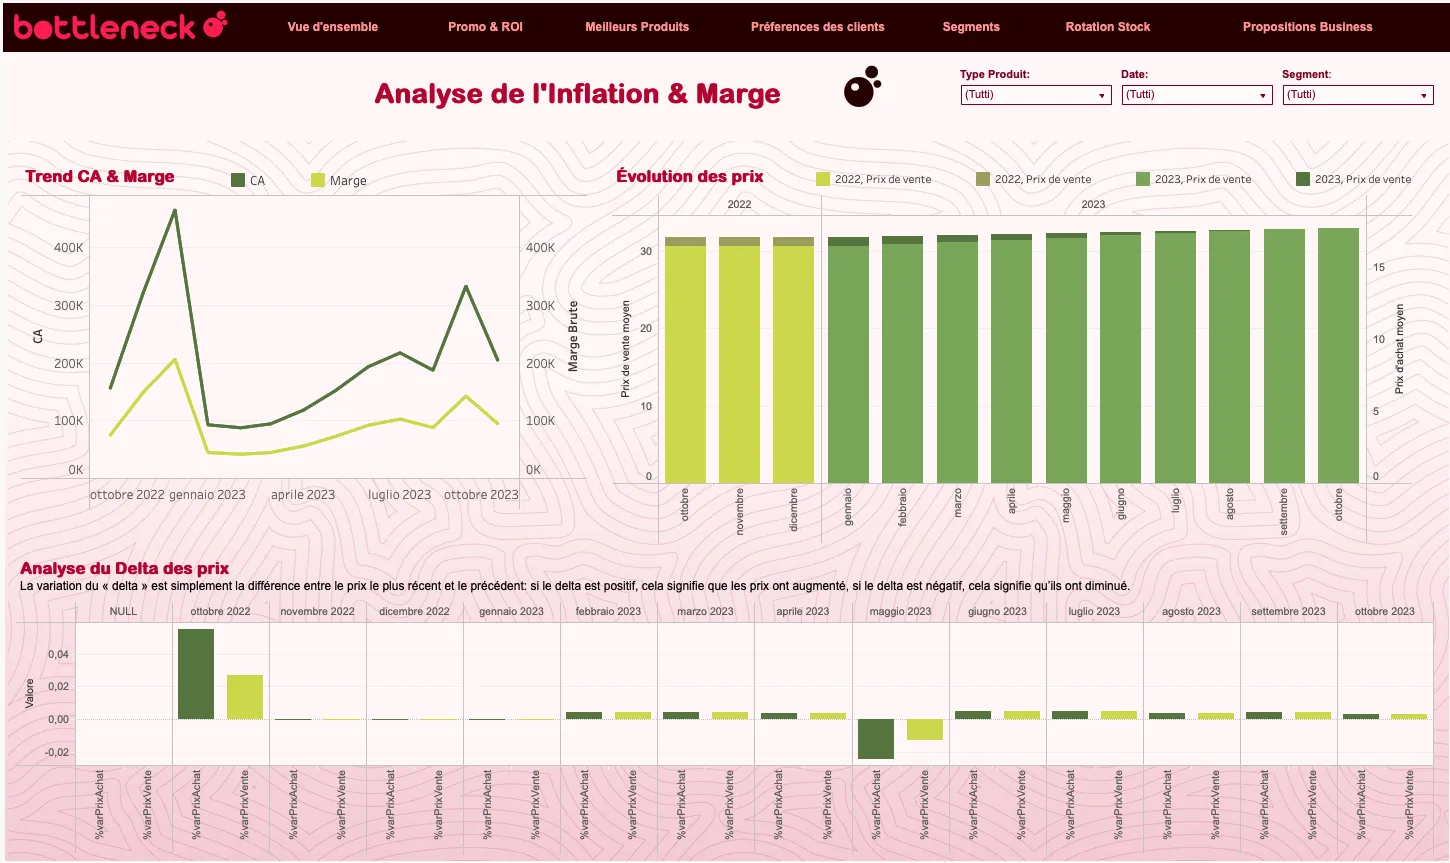
- Dashboard design: architecture with 8 themed tabs – Overview, Inflation & Margin, Promotions & ROI, Top Products, Customer Preferences, Segments, Stock Turnover, Business Recommendations.
Insights
- Automated pipeline: one “Refresh” click in Tableau triggers the notebook and updates the data.
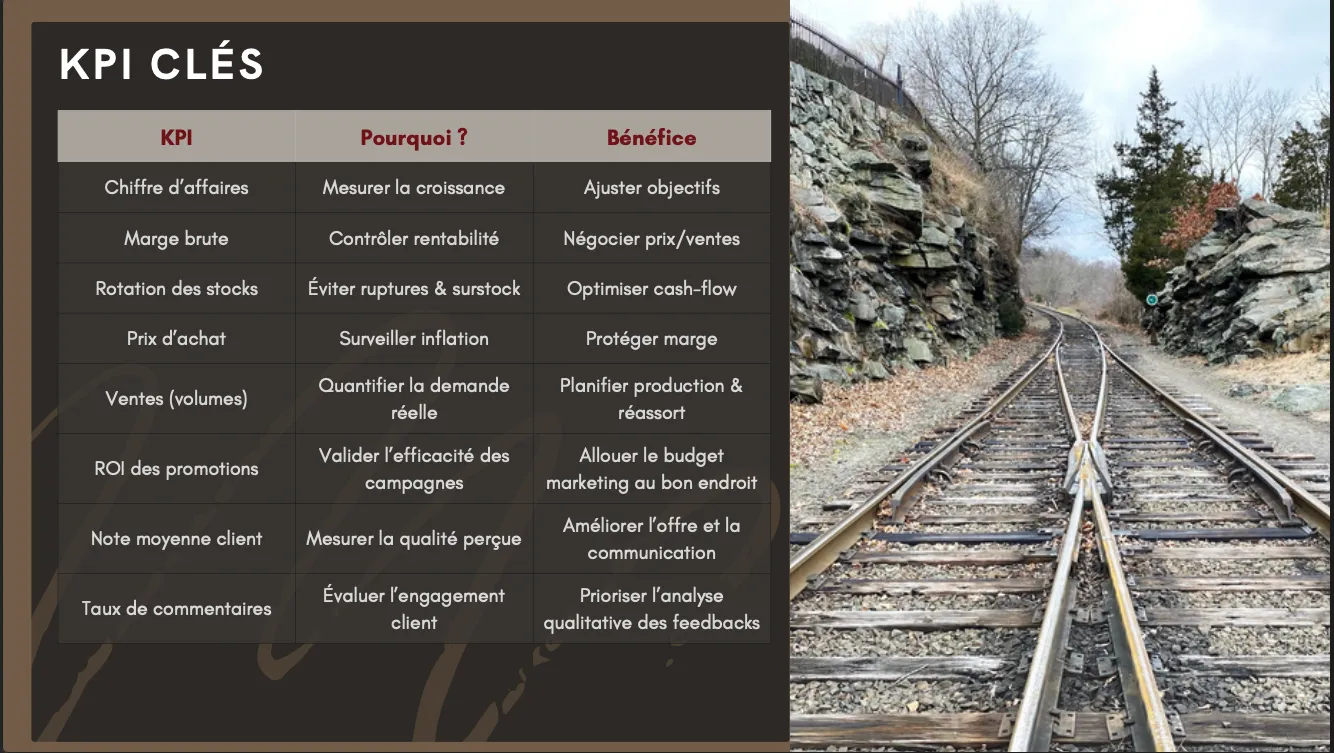
- 8 key KPIs:
- CA total and by segment
- Gross margin
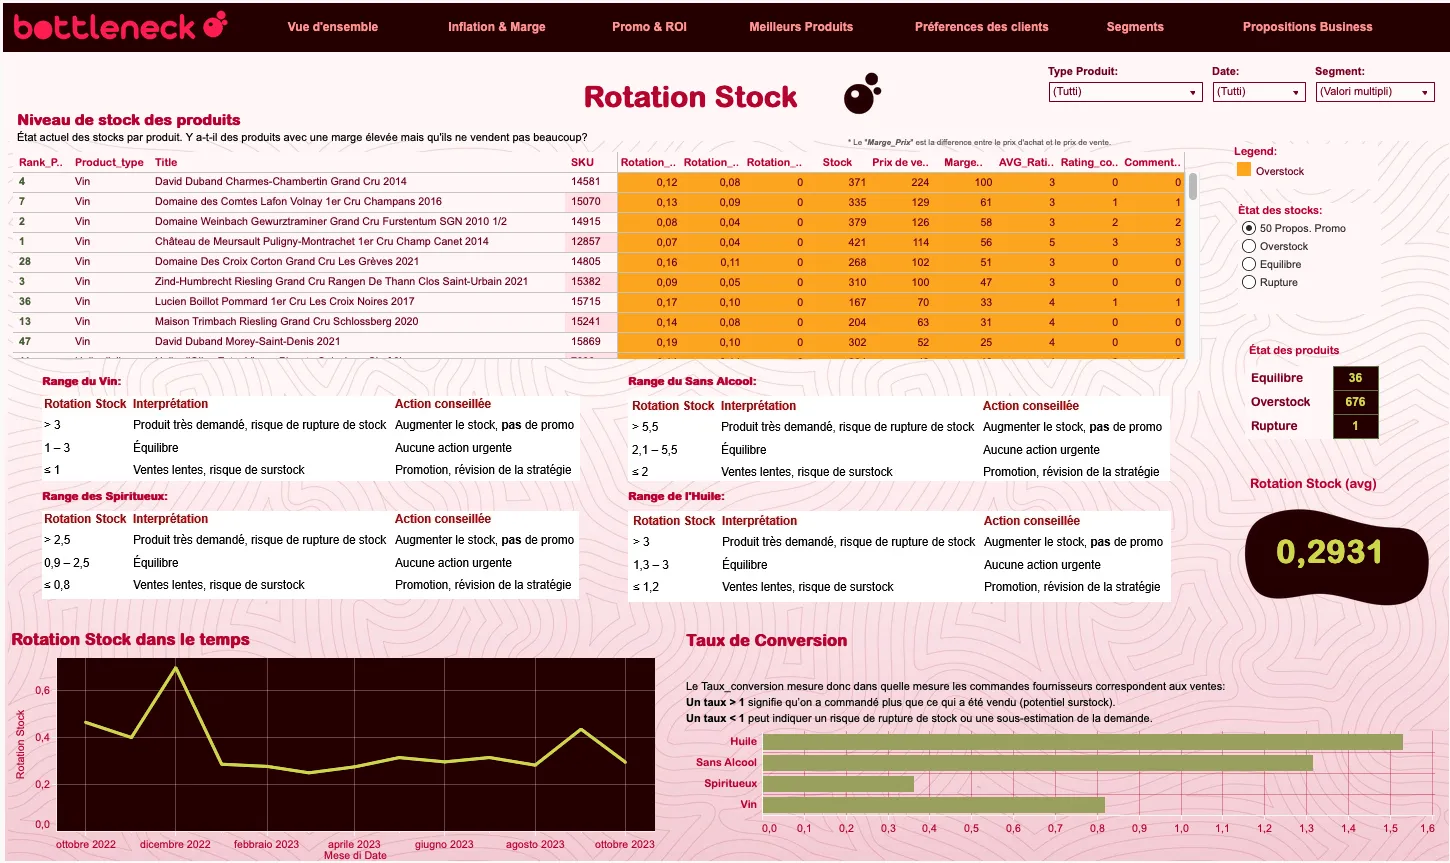
- Stock turnover
- Average purchase price (inflation)
- Sales volumes
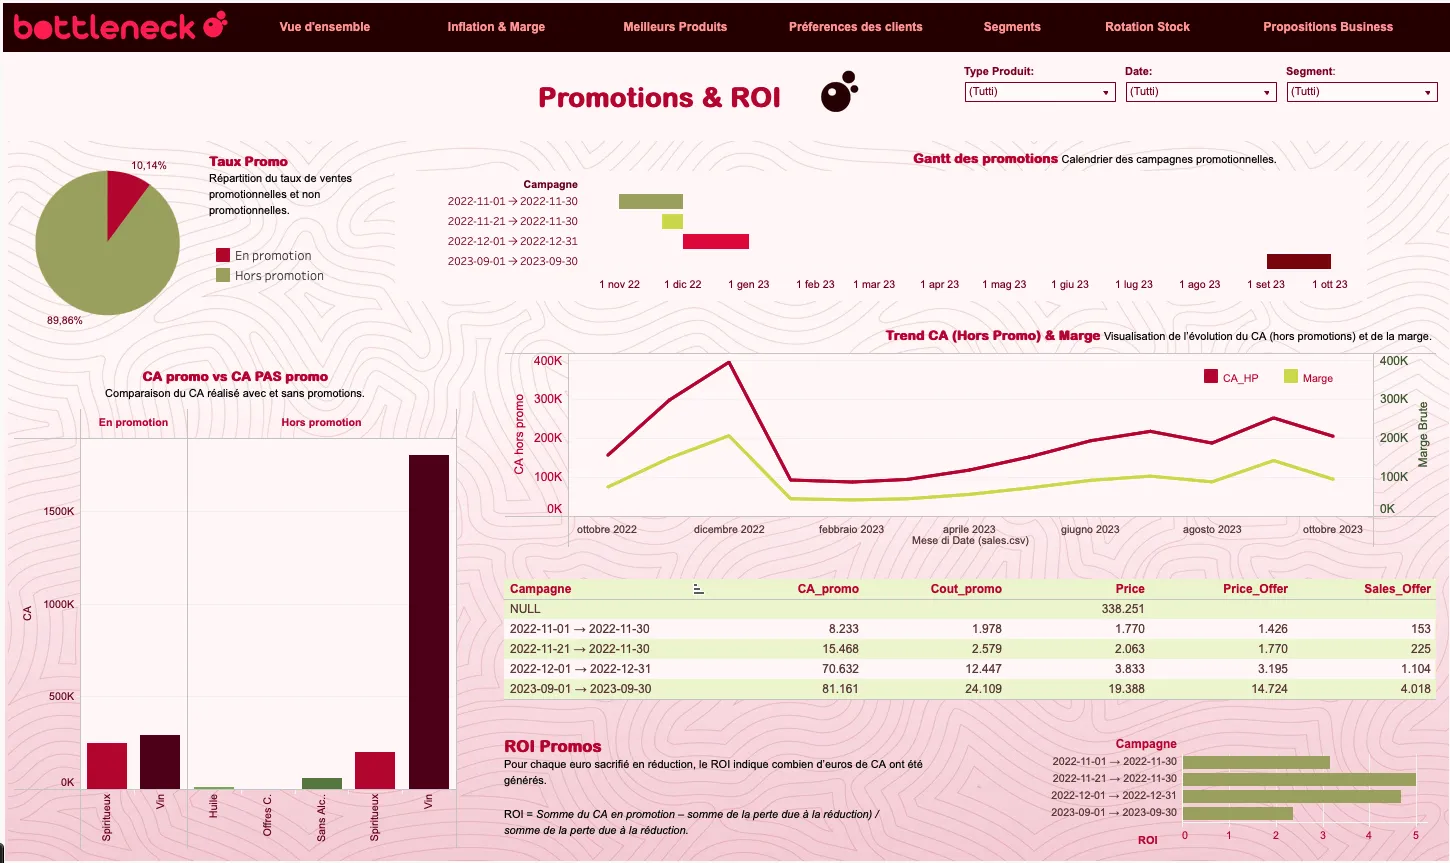
- Promo ROI
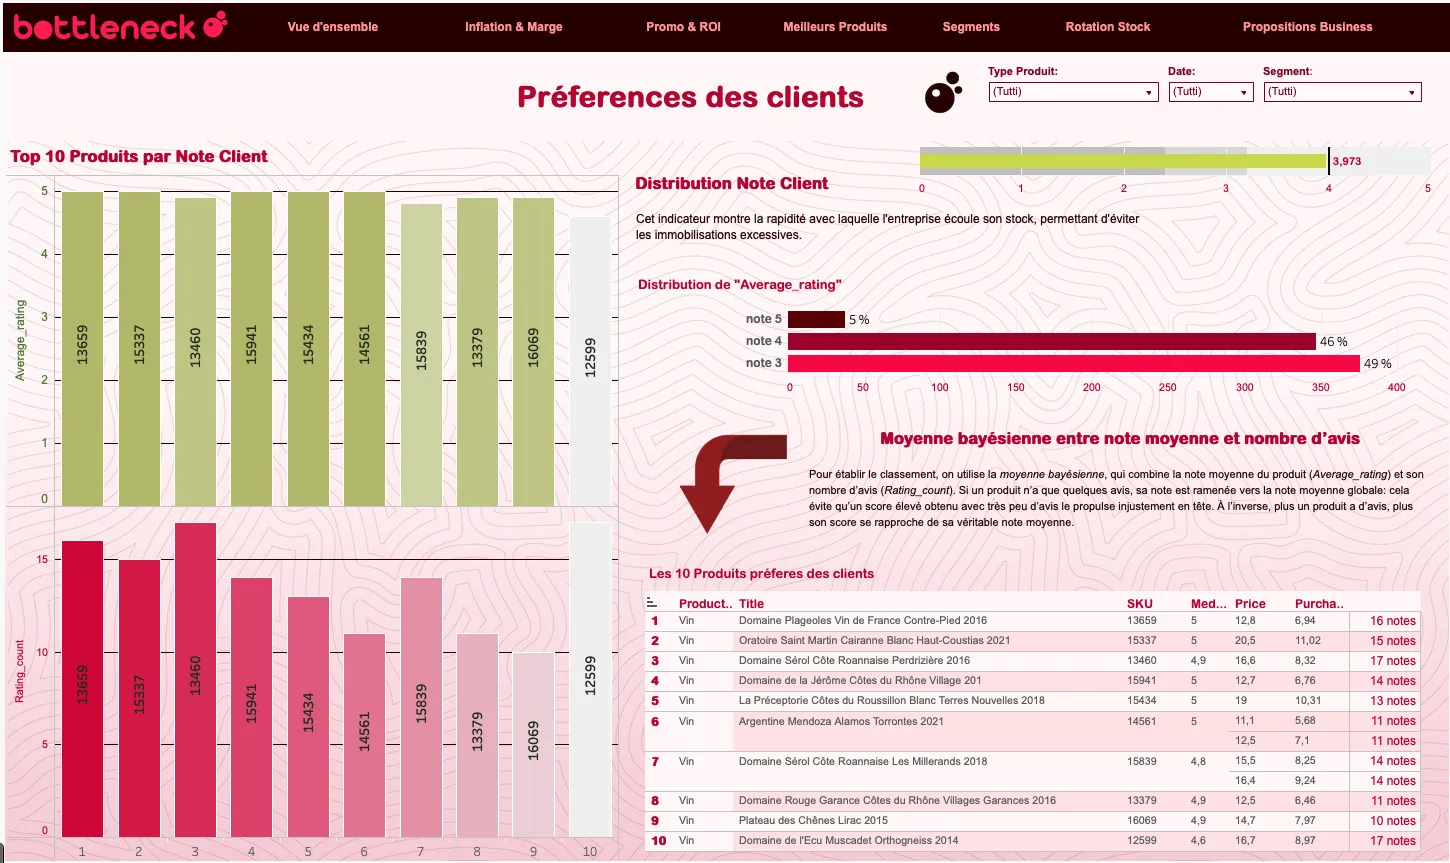
- Average customer rating
- Comment rate
- Business recommendations:
- Target low-turnover products to free up cash
- Don’t discount best-sellers to protect margins
- Align promotions with low-season periods
- Monthly tracking by segment
- Stock thresholds by segment
- Systematically leverage customer feedback
Business Impact
- A modular workflow – Python extraction → CSV → Tableau – ensures:
- Traceability and reproducibility
- Optimal performance (calculations done outside Tableau)
- Business user autonomy (no coding needed to refresh)
- A unified tool providing instant 360° data-driven decision support