Healthcare – European Cardiovascular Health Consortium (Personal)
Predicting Heart disease with Machine Learning
Fictional
|
01/10/2025 > 19/11/2025


Context
I was commissioned by the European Cardiovascular Health Consortium (ECHC) (fictional), a non-profit consortium of cardiovascular research centers, to develop a machine learning system for preventive heart disease screening. The project was supervised by Dr. Elena Rossi (Head of Preventive Cardiology).
My role was to:
- Build predictive models to assess cardiovascular disease risk from clinical data
- Optimize model performance while addressing overfitting issues
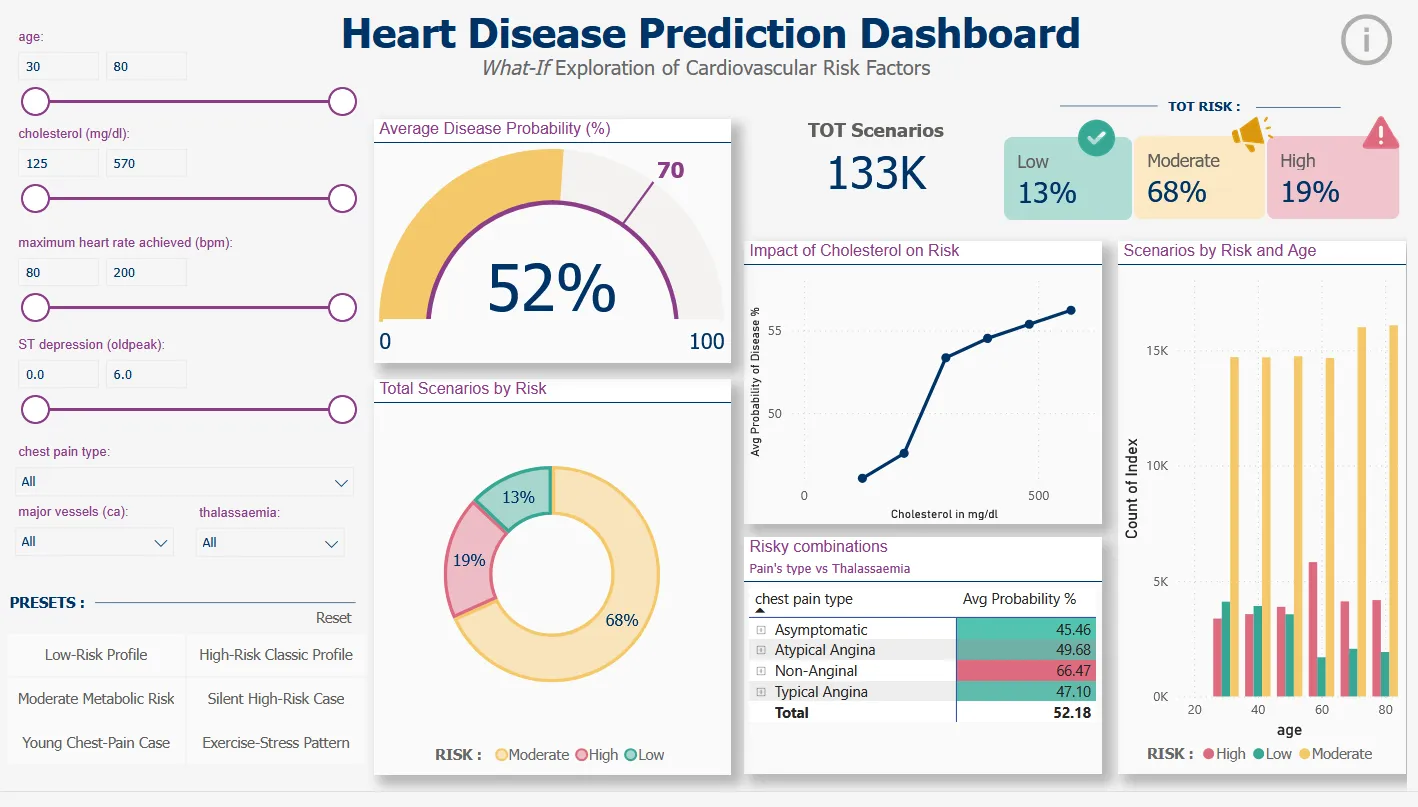
- Create an interactive Power BI dashboard enabling clinicians to explore “what-if” scenarios
- Translate complex ML predictions into actionable risk categories (Low/Moderate/High)
Datasets
Source:
UCI Heart Disease Dataset
Creators:
Hungarian Institute of Cardiology (Budapest), University Hospital (Zurich), University Hospital (Basel), V.A. Medical Center (Long Beach & Cleveland Clinic Foundation)
Main dataset:
- 303 patients from 4 international hospitals
- 13 clinical variables: age, sex, chest pain type (cp), resting blood pressure (trestbps), cholesterol (chol), fasting blood sugar (fbs), resting ECG (restecg), max heart rate (thalach), exercise-induced angina (exang), ST depression (oldpeak), ST slope (slope), colored vessels (ca), thalassemia (thal)
- Target variable: presence (1) or absence (0) of heart disease
Data quality: Zero missing values
Challenge: Original dataset had 5 imbalanced classes (0, 1, 2, 3, 4). Transformed into binary classification (Healthy vs Disease) to achieve balanced classes: 160 healthy (54%) vs 137 diseased (46%).
Dashboard dataset: 133,056 simulated scenarios generated by systematic combinations of clinical parameters for “What-If” analysis.
Workflow
Environment: Jupyter Notebook (Python 3) using scikit-learn, pandas, numpy, matplotlib, seaborn, joblib
1. Data Preparation:
Train-test split: 80% training (237 patients) / 20% test (60 patients) with stratification
Avoided data snooping: test set locked until final evaluation
5-Fold Cross-Validation on training set only for hyperparameter tuning
Preprocessing pipeline:
Numerical variables: median imputation + StandardScaler (μ=0, σ=1)
Categorical variables: One-Hot Encoding
2. Model Development:
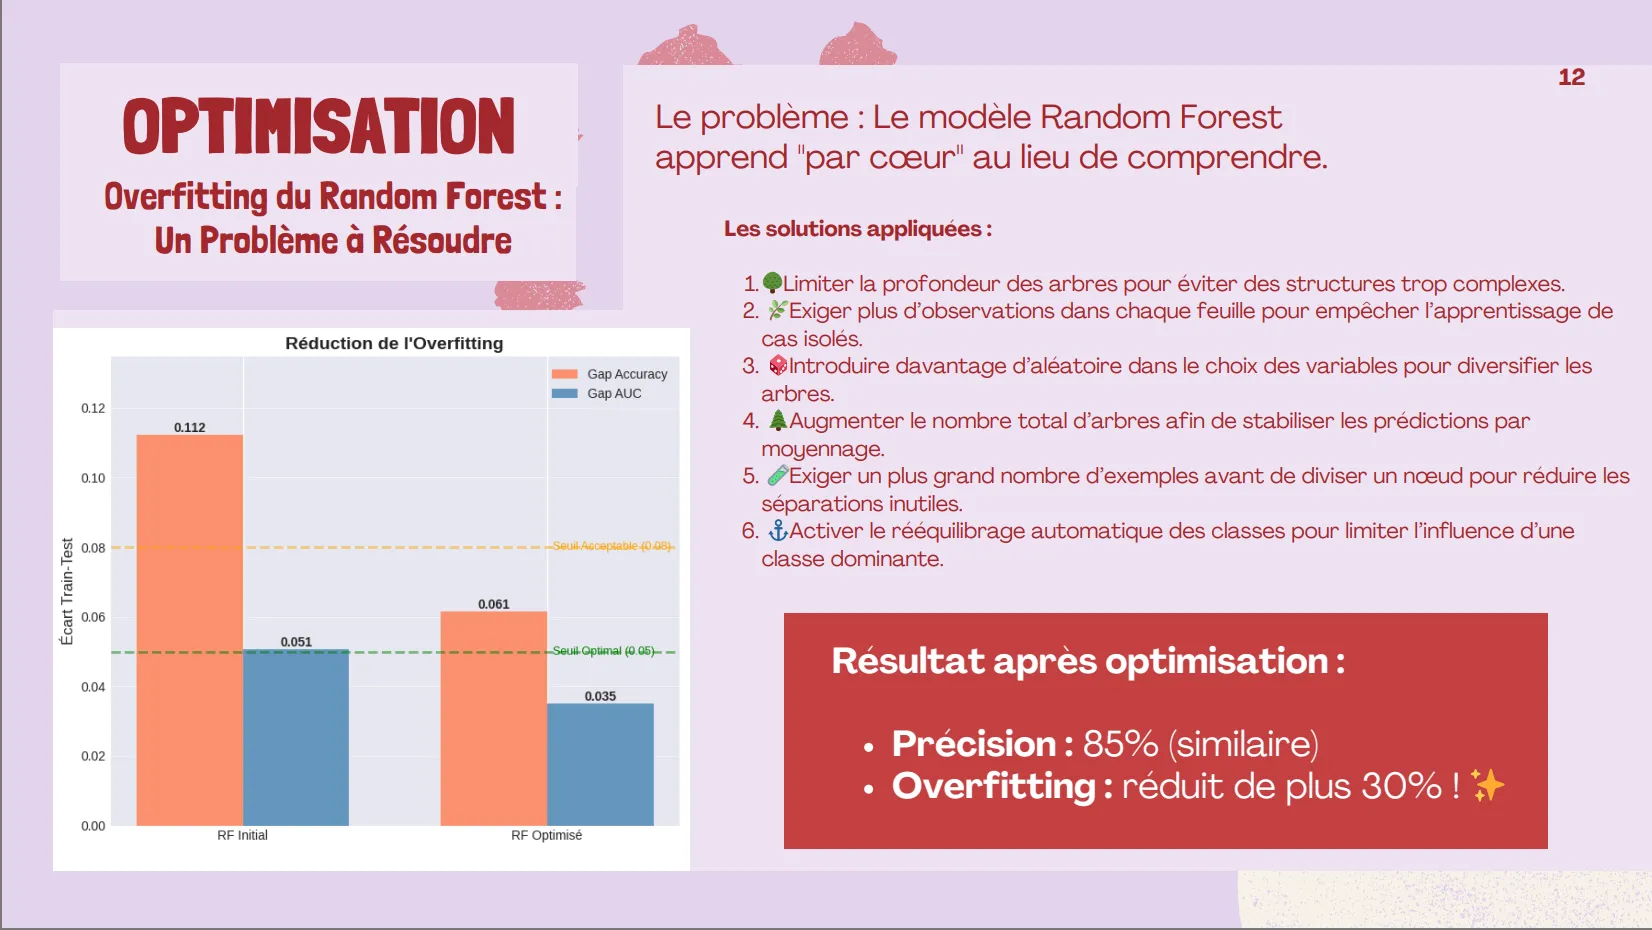
Model 1 – Random Forest:
Initial GridSearchCV with overfitting detected (AUC gap: 5.1%)
Regularization strategy applied:
- Limited tree depth (max_depth: 10)
- Increased minimum samples per split (min_samples_split: 5)
- Increased minimum samples per leaf (min_samples_leaf: 4)
- Feature randomization (max_features: ‘sqrt’)
Result after optimization: Accuracy 85%, AUC 0.946, reduced overfitting gap to 3.5%
Model 2 – Logistic Regression:
GridSearchCV with L2 regularization (C: 0.01)
Result: Accuracy 86.7%, AUC 0.951, zero overfitting
Model 3 – Stacking Ensemble:
Base models: optimized Random Forest + Logistic Regression
Meta-model: Logistic Regression with 5-fold CV
Result: Accuracy 83.3%, AUC 0.953 (best discrimination)
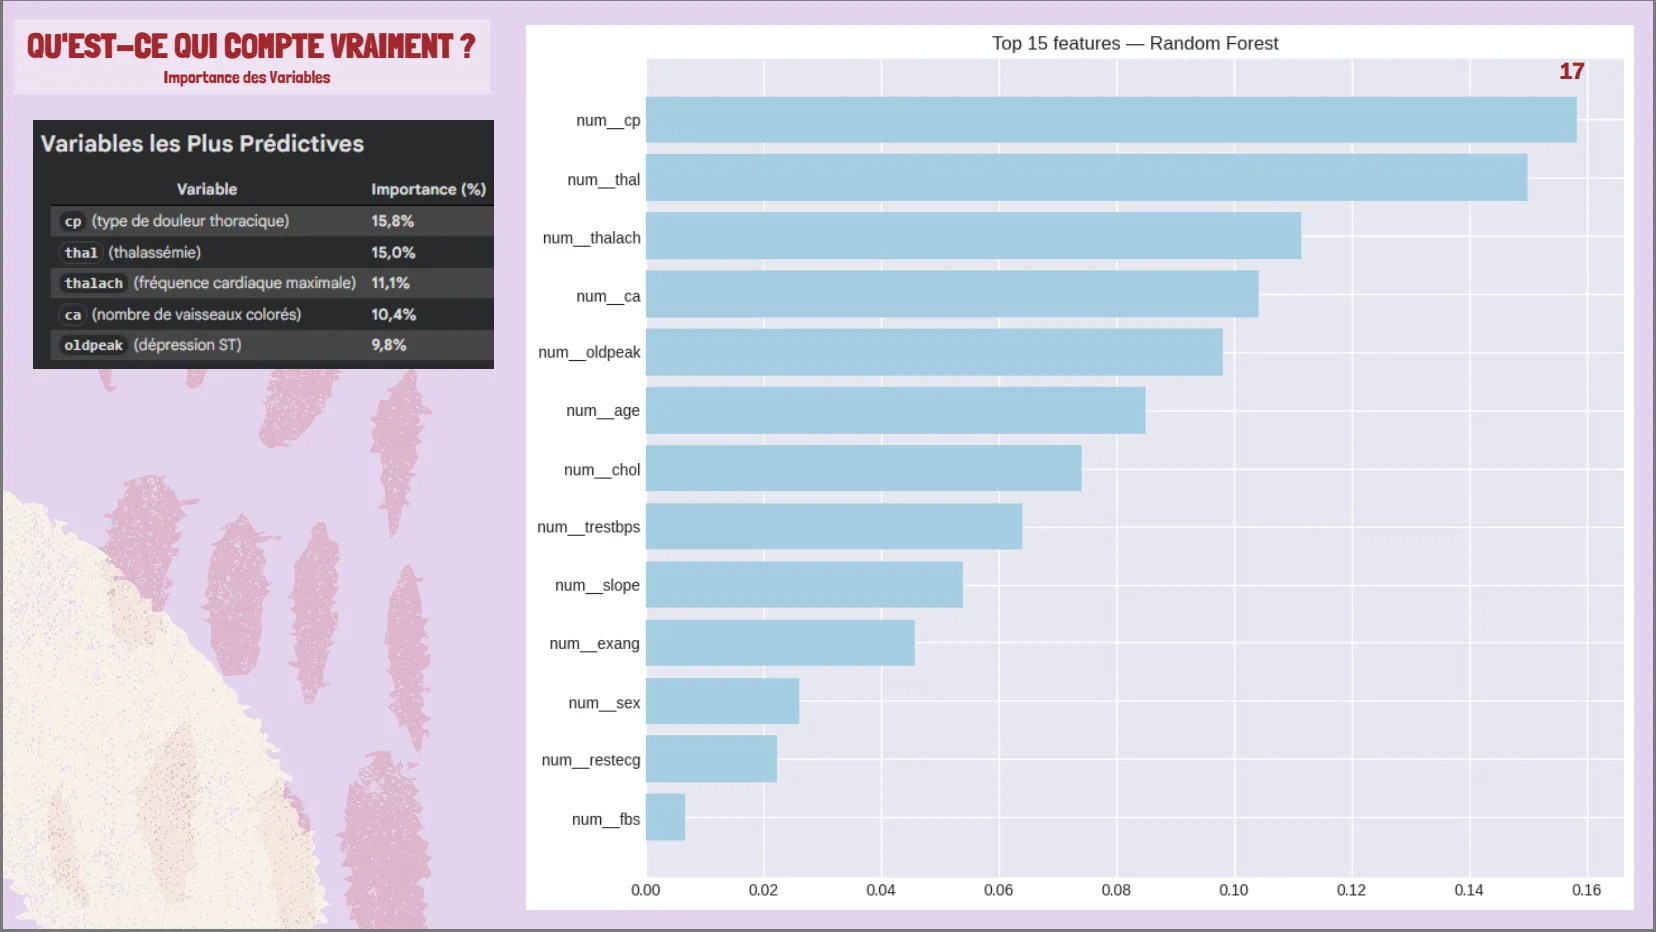
3. Feature Importance Analysis:
Top 5 predictive variables (62% total importance): chest pain type (15.8%), thalassemia (15.0%), max heart rate (11.1%), colored vessels (10.4%), ST depression (9.8%)
Surprising finding: cholesterol and fasting blood sugar had weak correlation with target
4. Dashboard Development:
Generated 133,056 What-If scenarios through systematic parameter combinations
Risk categorization: Low (<30%), Moderate (30-70%), High (≥70%)
Interactive Power BI dashboard with slicers for age, cholesterol, heart rate, chest pain type, thalassemia, ST depression, colored vessels
Exported as heart_disease_dashboard_stacking.csv
Insights
Model 1: Random Forest (Optimized)
- Test Accuracy: 85.0%
- Test AUC-ROC: 0.946
- Precision (Disease): 0.88
- Recall (Disease): 0.79
- F1-Score: 0.83
- Overfitting gap reduced: From 11.2% to 6.1% (45% improvement)
Model 2: Logistic Regression
- Test Accuracy: 86.7%
- Test AUC-ROC: 0.951
- Precision (Disease): 0.92
- Recall (Disease): 0.79
- F1-Score: 0.85
- Generalization: Excellent (negative gap = test > training)
Model 3: Stacking Ensemble (Selected)
- Test Accuracy: 83.3%
- Test AUC-ROC: 0.953 ✨ (highest)
- Cross-validation AUC: 0.903
- Precision (Disease): 0.88
- Recall (Disease): 0.75
- F1-Score: 0.81
- Overfitting: Negligible
Key findings
✅ Stacking achieved best discrimination (AUC = 0.953)
✅ Random Forest had highest sensitivity (79% recall = fewer missed cases)
✅ Logistic Regression had highest precision (92% = fewer false alarms)
✅ All models exceeded 0.94 AUC (excellent clinical performance)
Feature Importance (Top 5)
- Chest pain type (cp): 15.8%
- Thalassemia (thal): 15.0%
- Max heart rate (thalach): 11.1%
- Colored vessels (ca): 10.4%
- ST depression (oldpeak): 9.8%
Total contribution: 62% of predictive power
Business Impact
For Clinicians:
- Rapid screening tool with 95% discrimination accuracy supporting triage decisions
- Evidence-based prioritization: identifies which patients need immediate cardiological workup vs routine follow-up
- Explainable predictions: feature importance shows which clinical factors drive risk assessment
For Patients:
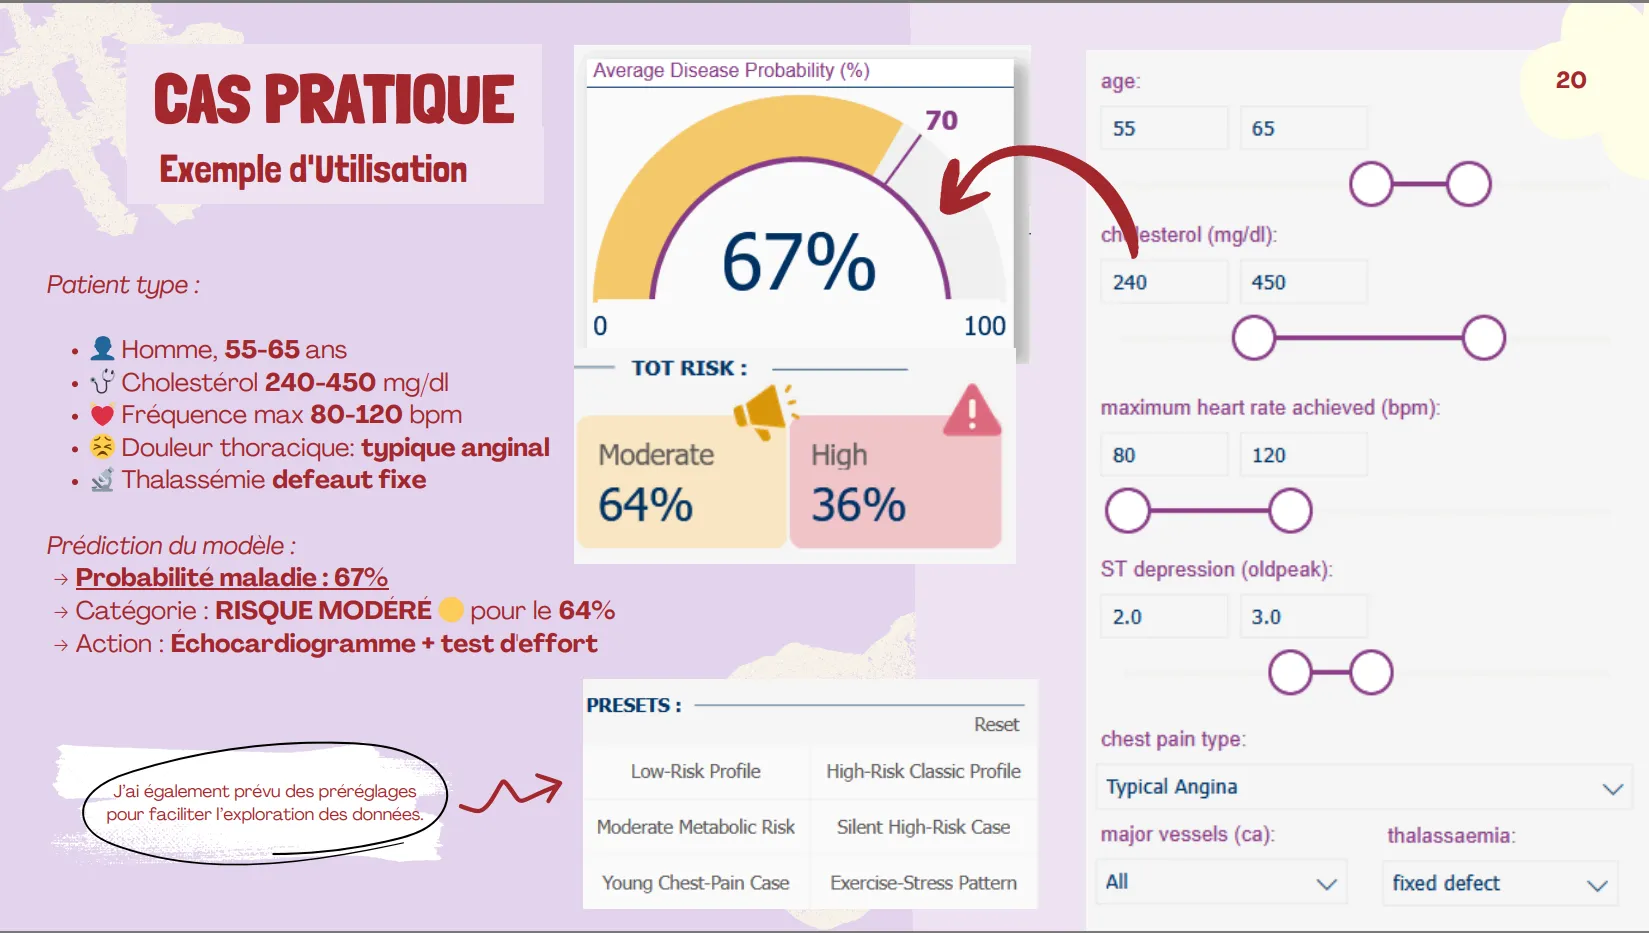
- Visual risk communication: interactive dashboard translates complex probabilities into clear Low/Moderate/High categories
- Empowerment: patients can see how lifestyle changes (reducing cholesterol, improving fitness) would impact their risk score
For Healthcare System:
- Resource optimization: focuses expensive diagnostic tests (echocardiograms, angiography) on moderate/high-risk patients
- Preventive economics: early detection reduces costly emergency interventions and hospitalizations
- Scalability: model processes unlimited scenarios instantly for population health management
Scientific Contribution:
- Demonstrated that ensemble methods (Stacking) combining linear and non-linear approaches outperform individual models
- Confirmed that diagnostic variables (chest pain characteristics, exercise test results) are more informative than isolated risk factors
- Provided reproducible methodology for small medical datasets (n=303) with rigorous overfitting control
Limitations Acknowledged:
- Small dataset (303 patients) limits generalization
- Geographic bias (4 hospitals only)
- Recall 75-82%: some diseased patients still missed (false negatives)
- Requires validation on prospective real-world patient cohorts