E-commerce – BottleNeck (Openclassroom)
Stock Management & Data Cleaning
Fictional
|
01/02/2025 > 09/03/2025
Context
I joined BottleNeck (fictional), a wine merchant, on a mission led by Nicolas (sales manager) to optimize stock and sales management. My role was to aggregate ERP, website, and mapping table exports, detect and fix inconsistencies, then deliver analyses and recommendations to the executive committee.
Datasets
- ERP export (CSV): product reference, purchase price, selling price, stock status as of October 31 (825 rows × 6 columns)
- Website export (CSV): SKU, quantity sold from October 1 to 31, 2020, titles, categories, availability (1,513 rows × 29 columns)
- Mapping table (CSV): match between ERP PRODUCT_ID and website SKU (825 rows × 2 columns)
- Final aggregated dataset: 825 rows × 35 columns, enriched with flag columns (negative values, missing data, error counts)
Workflow
- Jupyter Notebook/Python environment (pandas, numpy, scipy) for ETL and EDA
- Merging of the three sources via joins; duplicate detection and aggregation on
TOTAL_SALES - Inconsistency handling:
- Negative values converted to NaN and flagged
- Missing values identified and counted
- Missing SKUs resolved via price/availability match
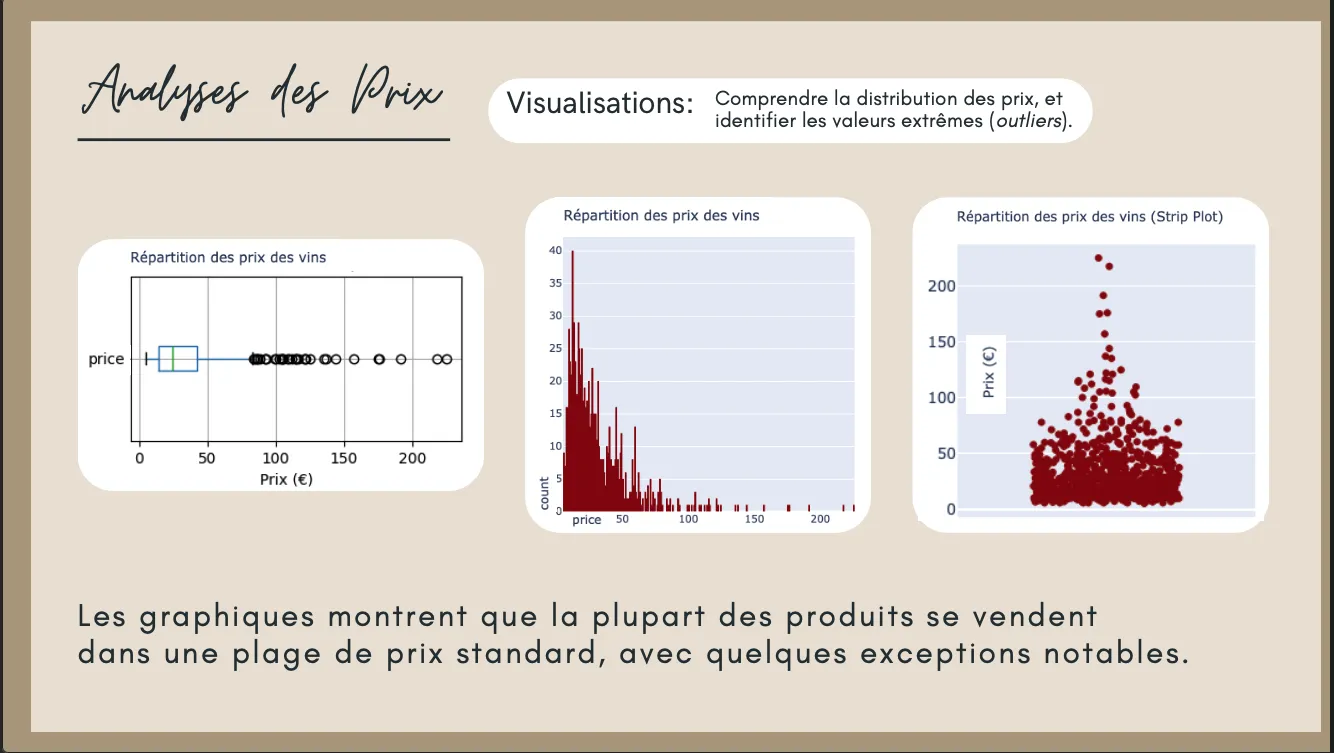
- Univariate analysis: price distribution, outlier detection (IQR, z-score)
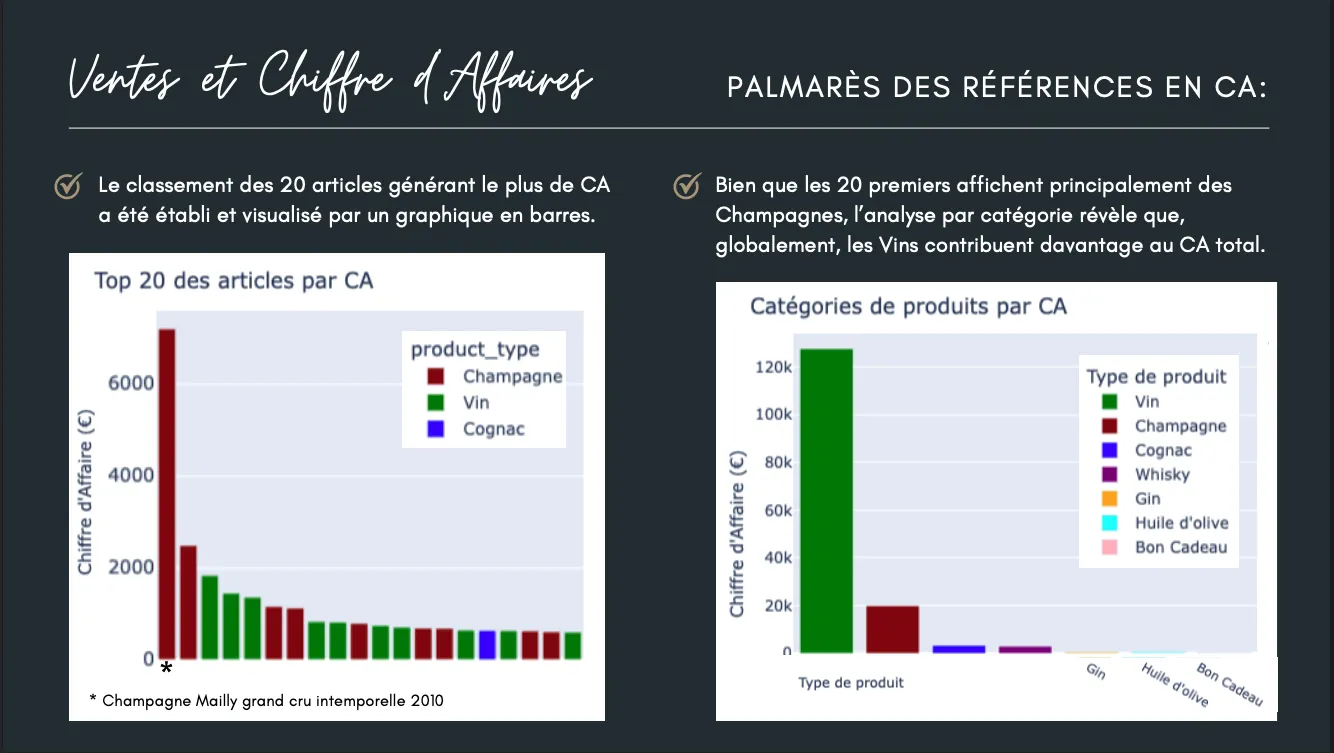
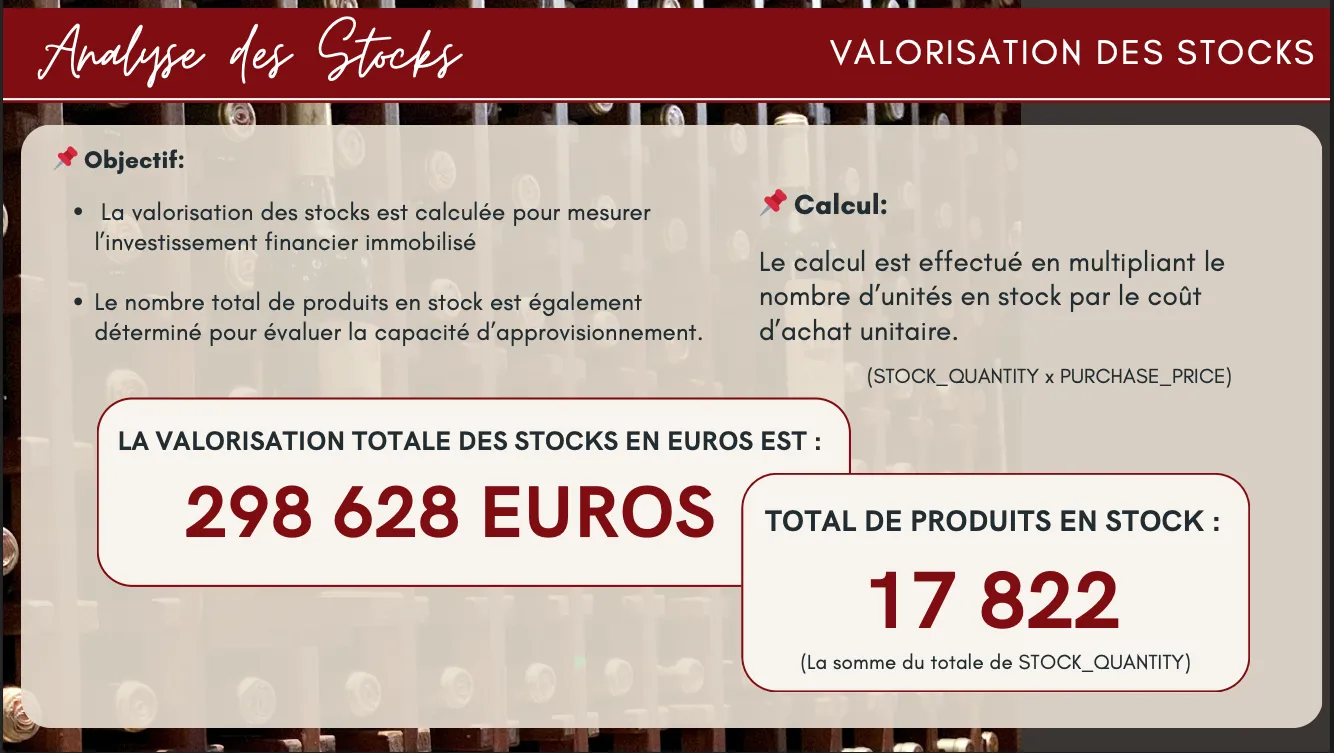
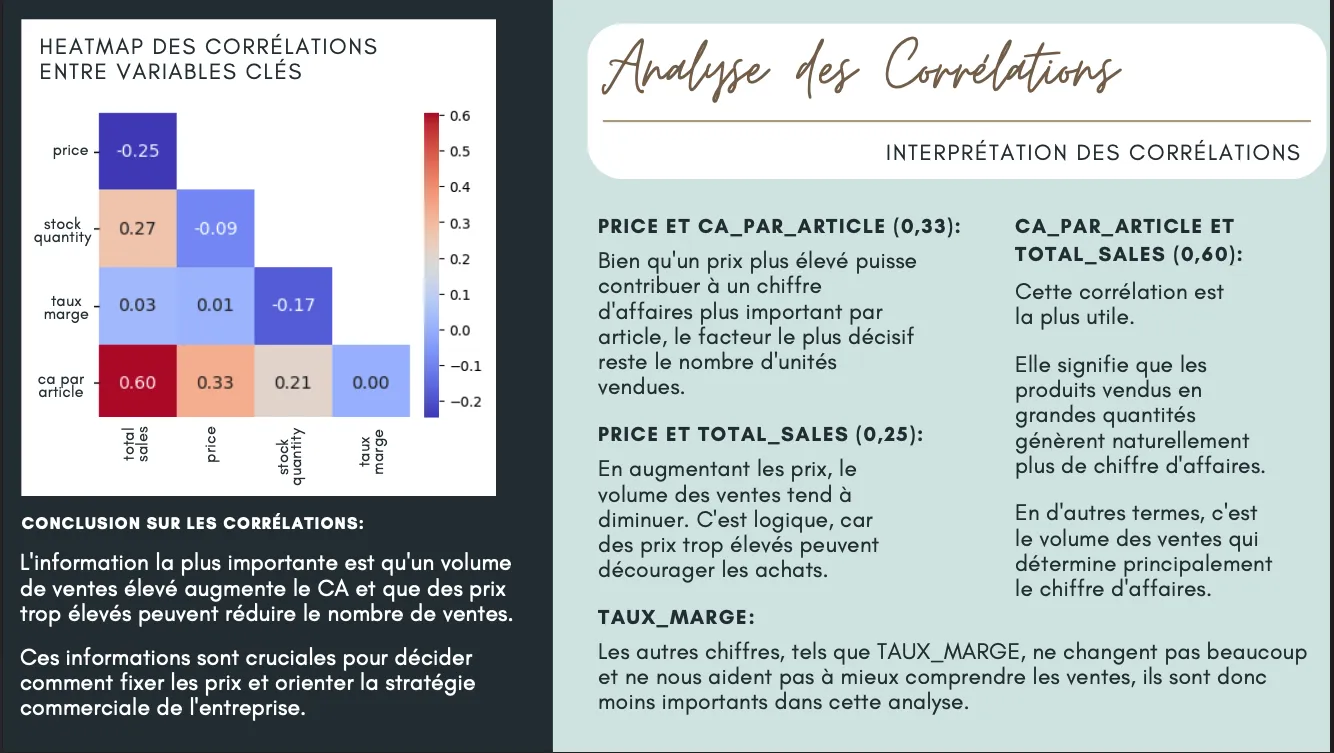
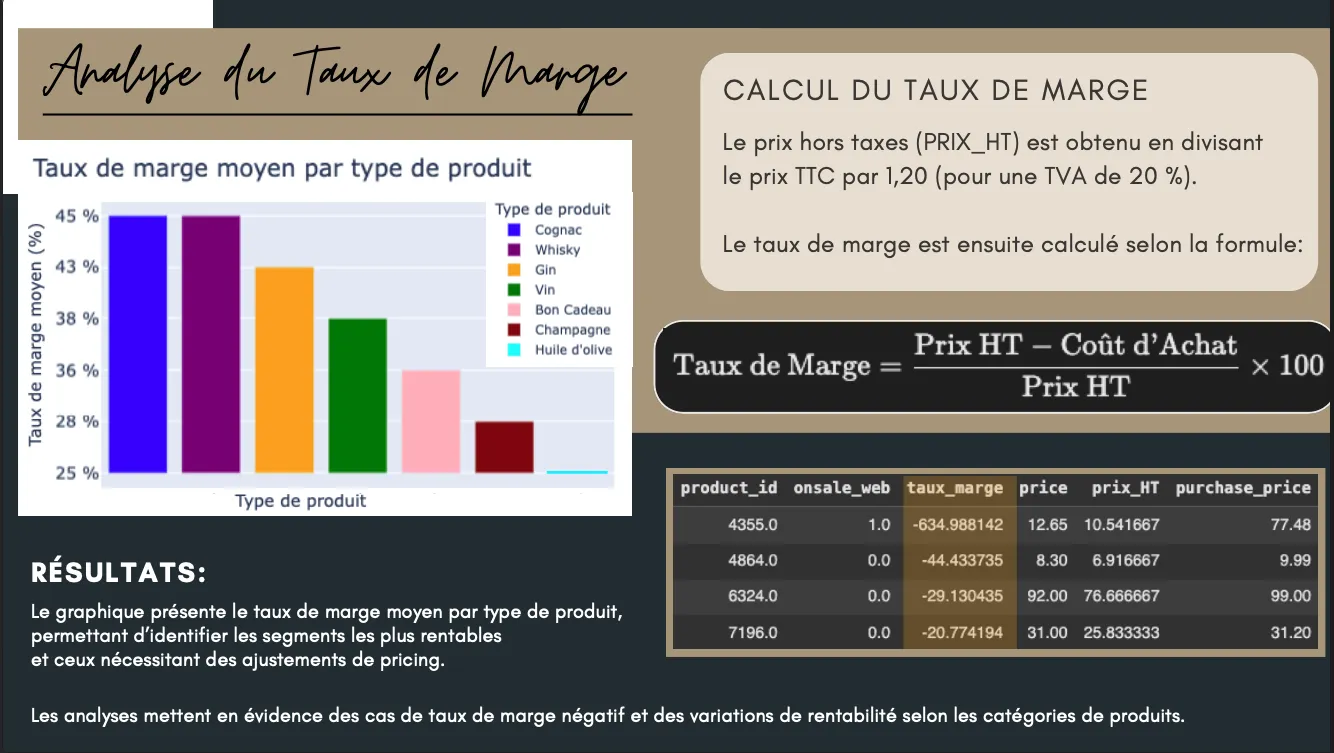
- Multivariate analysis: revenue per product, 20/80 ranking, stock turnover (months_available), stock value (STOCK_QUANTITY × PURCHASE_PRICE), margin rate, correlation analysis (heatmap)
- Exploratory visualizations integrated into the notebook to support findings
Insights
- 714 initial duplicates, consolidated using business rules (aggregation or priority)
- 36 outliers detected via z-score, 16 via IQR; average price: €32.35 (standard deviation: €26.62)
- Total revenue: €154,623 (excluding outliers: €146,028); top 20 items generate 80% of revenue (59% of website catalog)
- Stock valuation: €298,628 immobilized across 17,822 units in stock
- Average margin rate by category, including identification of negative-margin products
- Correlations: CA_par_article↔TOTAL_SALES (0,60), PRICE↔TOTAL_SALES (0,25), PRICE↔CA_par_article (0,33) ; Volume is more decisive than price
Business Impact
Thanks to this work, BottleNeck now has:
- A reliable, traceable dataset for any future visualization project
- A clear understanding of key strategic products (20/80 rule) to optimize the catalog
- Concrete recommendations: adjust prices of best-sellers, progressively reduce prices of slow-moving stock, fix missing SKUs, maintain data quality
- A reproducible ETL protocol to ensure ongoing reliability and traceability