Healthcare – Sanitoral (Openclassroom)
Power BI Project Dashboard
Fictional
|
10/03/2025 > 10/04/2025

Context
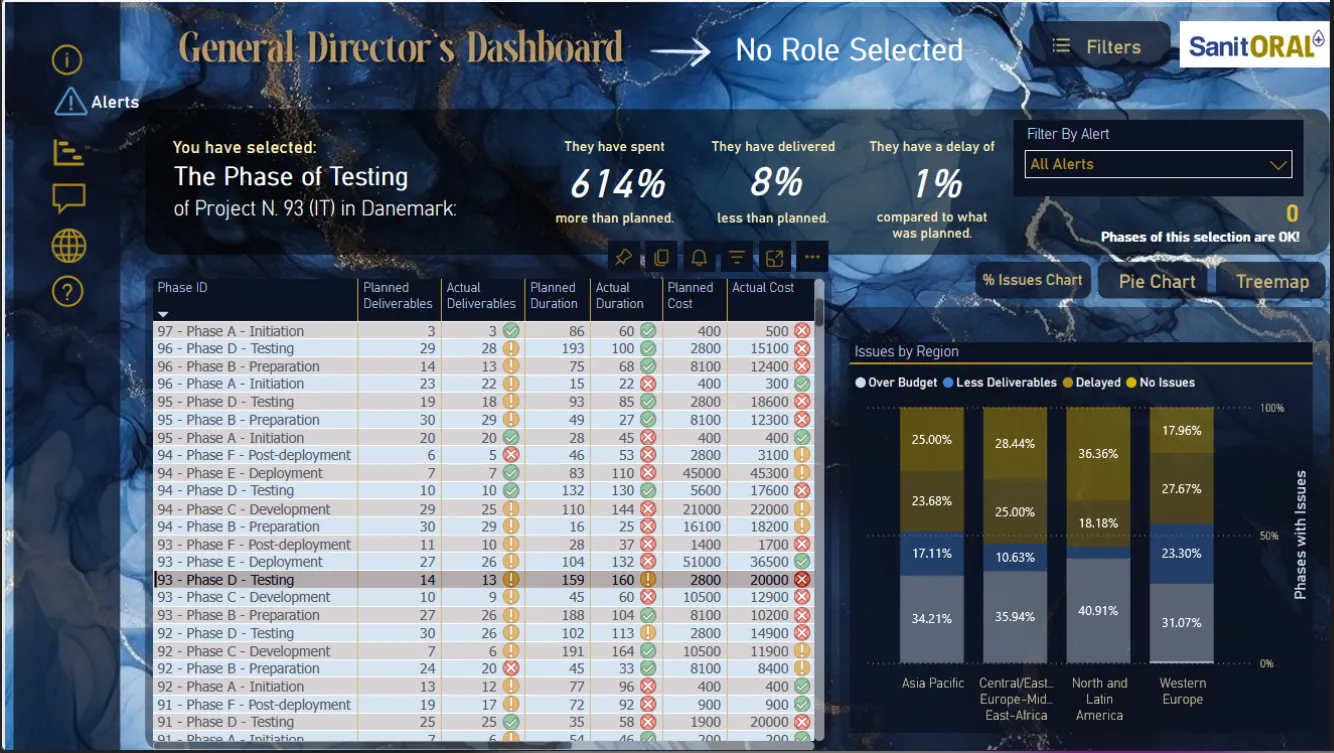
I was tasked by Sanitoral, an international oral care manufacturer, to design a dynamic Power BI dashboard to:
- Track the progress of their projects (IT and Marketing types, from 2018 to early 2022);
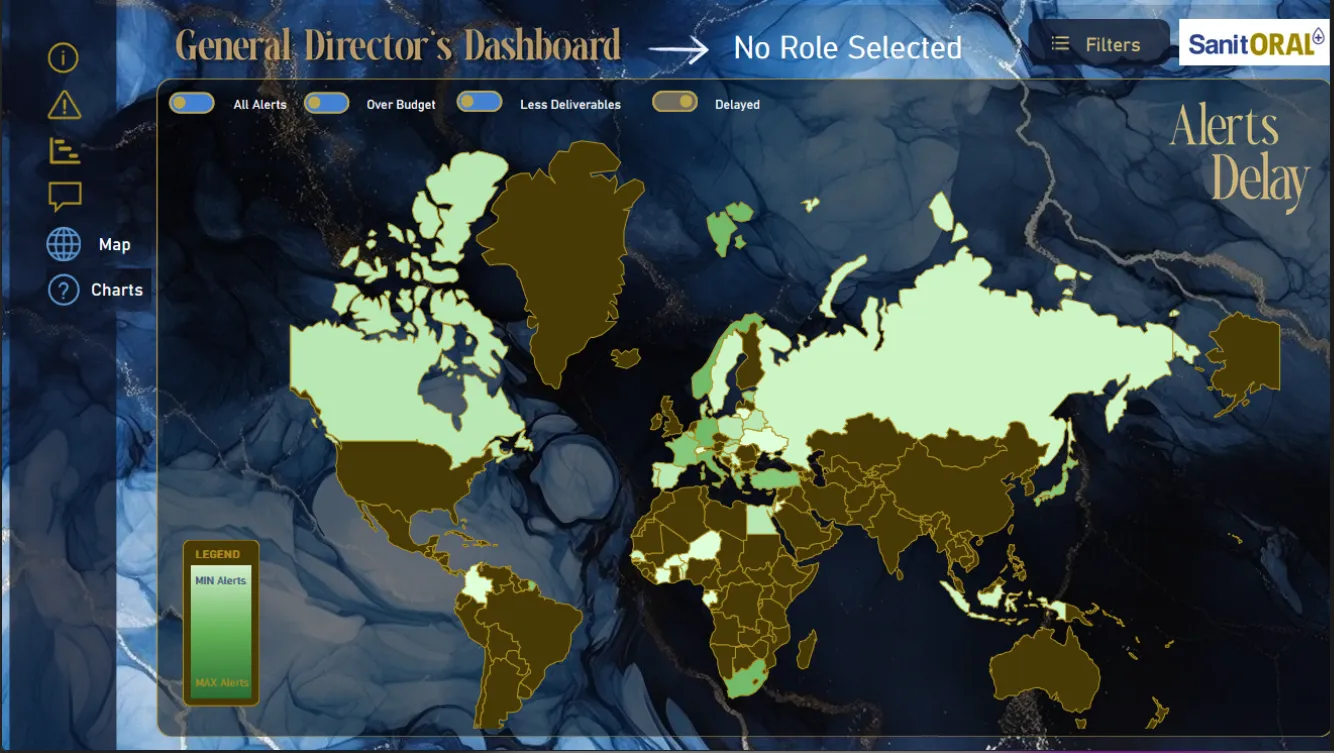
- Automatically flag budget overruns (> +15 %), delays (> +15 %) and delivery shortfalls (< –15 %);
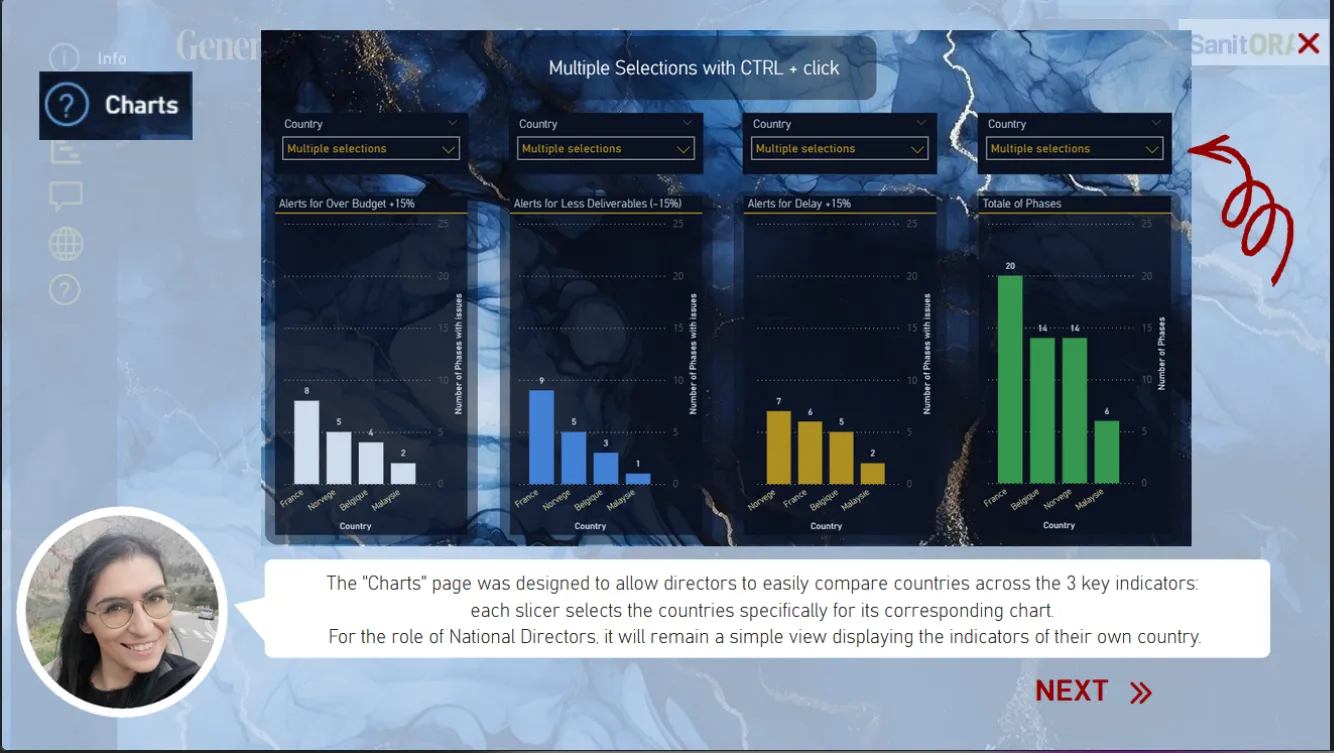
- Let directors (Global, Regional, Country) filter by phase, project type and geographic area to guide strategic decisions.
The Product Strategy Canvas was approved on March 14, 2025 by Sophie, project manager, and I structured the user stories for each role accordingly.
Datasets
- Source: export from Sanitoral’s project management software (CSV files imported into Power BI)
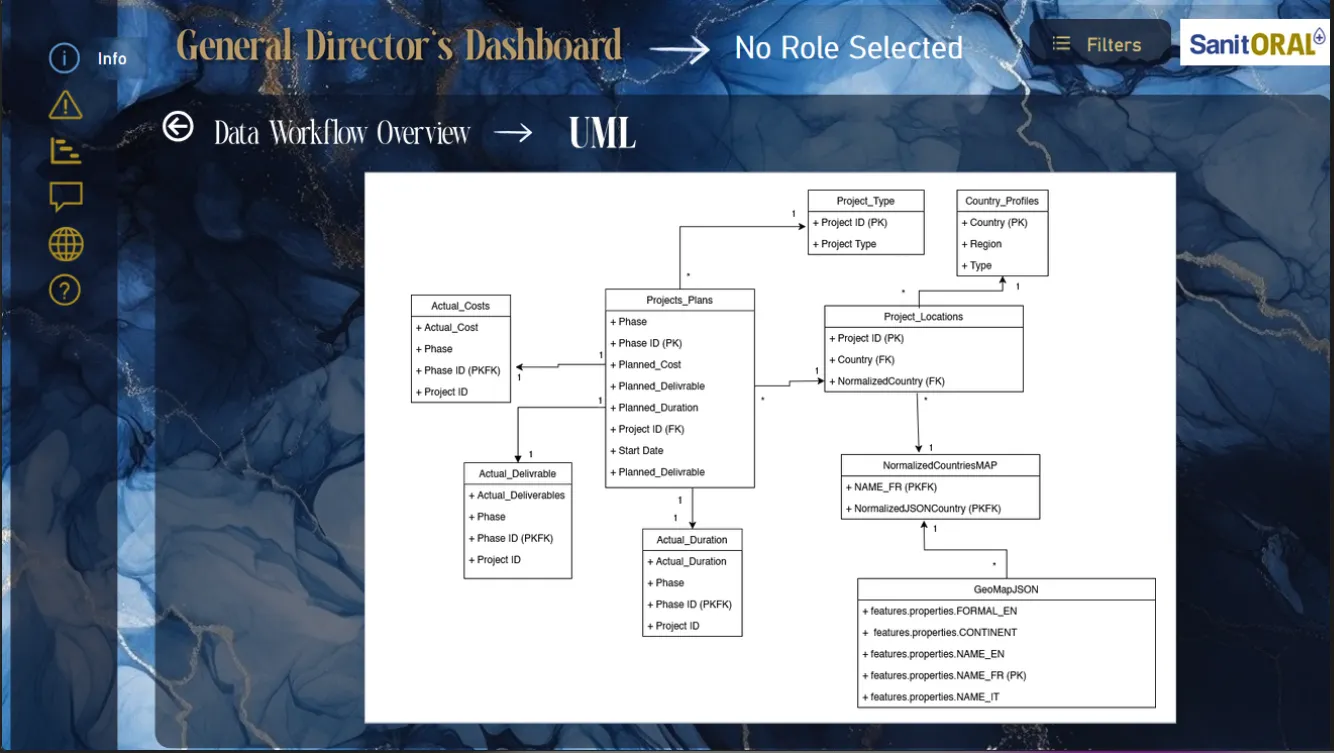
- Tables:
- Projects plans: Project ID, Phase, Phase ID, Start Date, Planned_Duration, Planned_Cost, Planned_Delivrable (520 rows)
- Project Type: Project ID, Project Type (520 rows)
- Actual Cost: Project ID, Phase ID, Phase, Actual_Cost (520 rows)
- Actual Delivrable: Project ID, Phase ID, Phase, Actual_Delivrable (520 rows)
- Actual Duraction: Project ID, Phase ID, Phase, Actual_Duraction (520 rows)
- Country Profiles: Country, Region, Type (52 rows)
- Project Location: Project ID, Country, NormalizedCountry, NormalizedCountryMAP.NAME_FR (104 rows)
Workflow
- Scoping: formalized PSC (Product Strategy Canvas) validated with the client
- Pre-processing:
- Power Query Editor to automate cleaning steps: date cleanup, typing, duplicate removal, calculated columns (actual vs planned durations, % budget consumed)
- Joined tables (Projects ↔ Phases ↔ Deliverables) without altering source files
- Data modeling: star schema in Power BI (1–N relationships)
- Dashboard development:
- DAX measures for:
- % budget overrun
- % delay
- % delivery variance
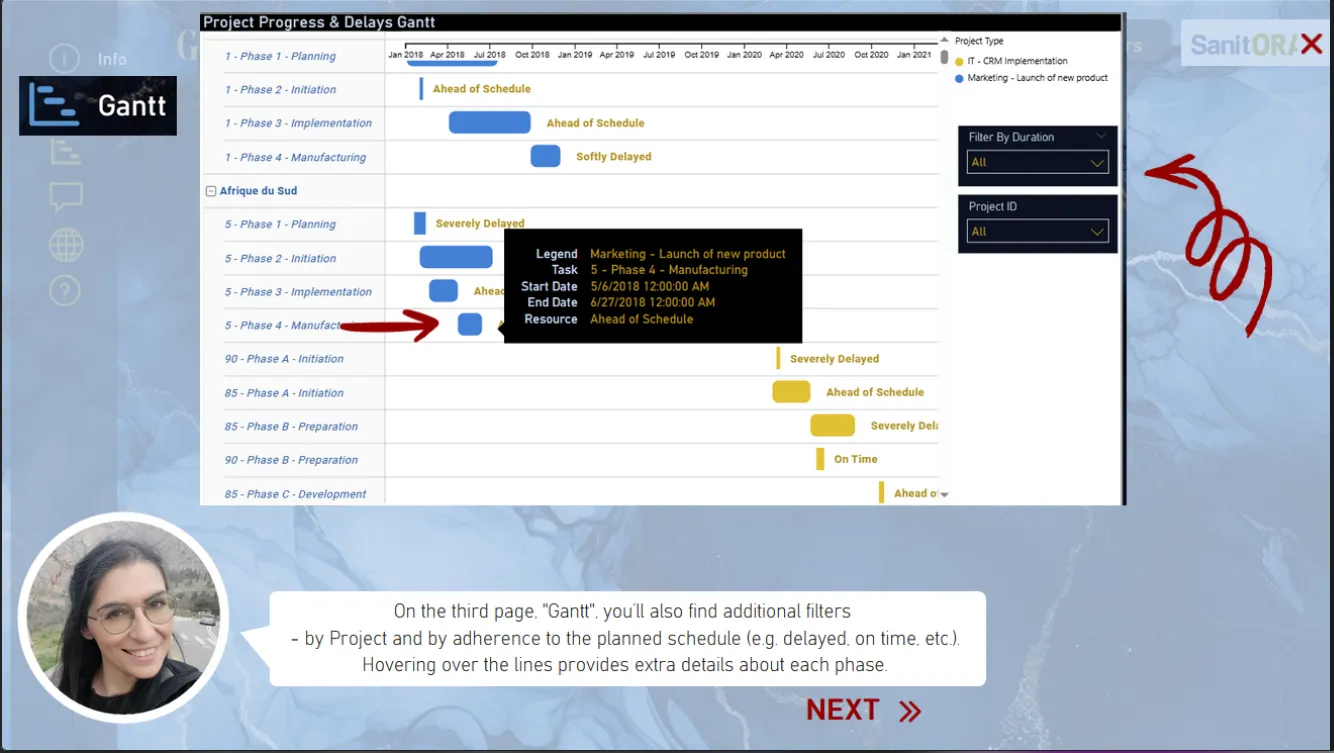
- Key visuals: KPI cards, Gantt chart by project type (Gantt extension), delay heatmap, slicers (country, phase, type)
- DAX measures for:
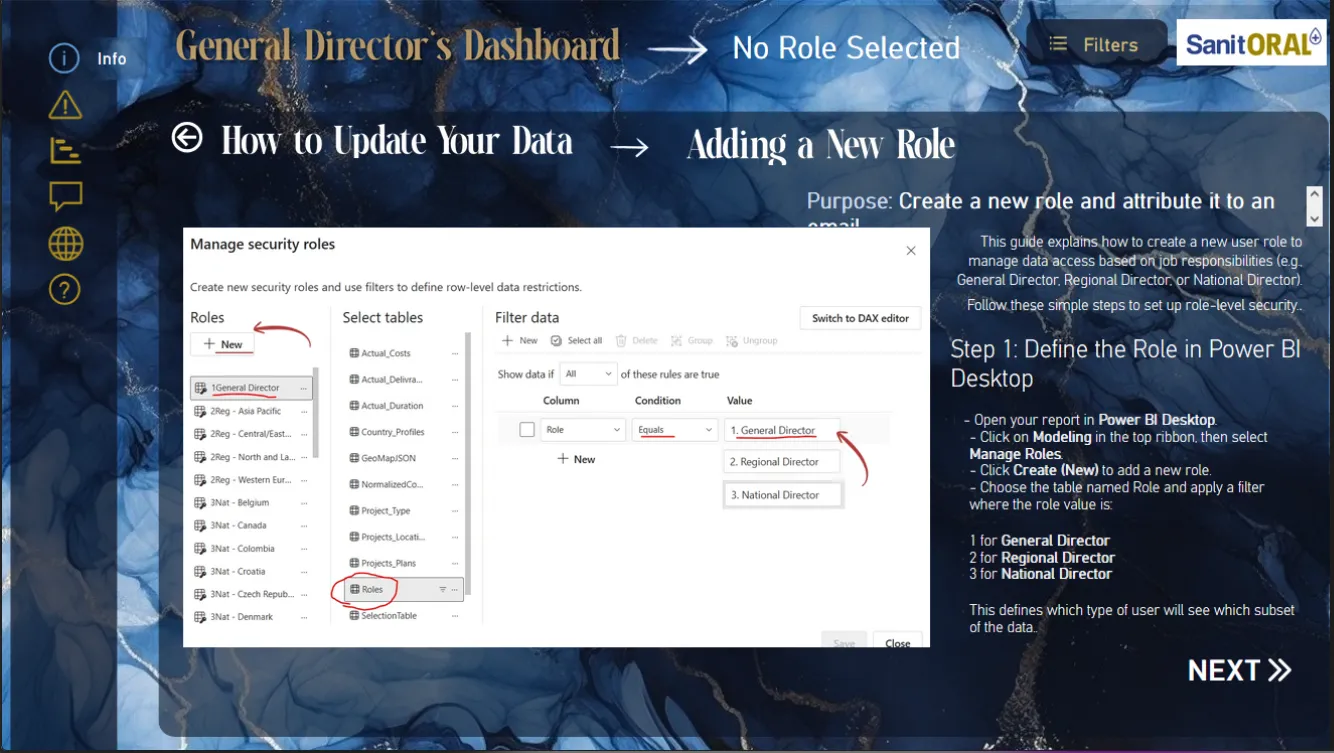
- Storytelling & documentation: “Mise à jour” tab with PSC image and Power Query procedure screenshots
Insights
- Overall results:
- 46 % of phases exceeded budget by > 15 %
- 18 % of phases had delays > 15 %
- 30 % of phases delivered < 85 % of planned deliverables
- 28 % of phases met all three KPIs
- Performance by project type:
- IT vs Marketing – comparison of delay and overrun rates: IT had 11 % more phases with issues
- Geographic analysis:
- Countries with the highest delays also have the greatest workload
- Strategic directions:
- Improve anticipation on high-delay phases
- Adjust budget planning and timelines by project type and region based on workload
Business Impact
Thanks to this dashboard, Sanitoral can now:
- Monitor progress in real time and anticipate delays.
- Manage budgets and adjust resource allocations before executive committees.
- Refresh data weekly via Power Query.
- Use a structured storytelling tool for CODIR decision making.